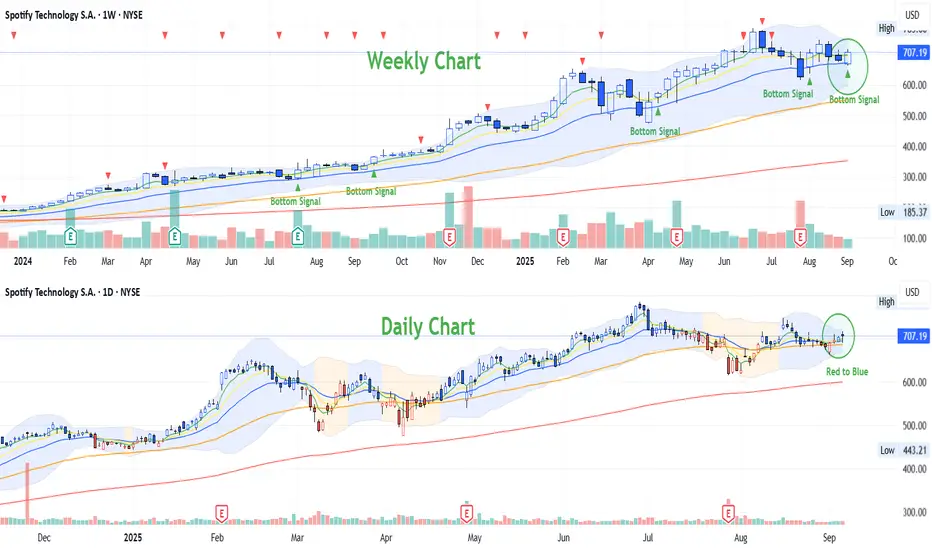
Weekly Chart: Bottom Signal is triggered on this week (week1 of September). Is this mean the consolidation will be done on September? And the long term uptrend will be continued? Based on the historical data, whenever the bottom signal was appeared, there was the beginning of the new wave..
Daily Chart: Red candlestick just turn to Blue Candlestick in Blue Zone. The system is telling us maybe this is just a beginning of another uptrend wave.
Let's monitor this long term uptrend stock from today onwards. :)
Daily Chart: Red candlestick just turn to Blue Candlestick in Blue Zone. The system is telling us maybe this is just a beginning of another uptrend wave.
Let's monitor this long term uptrend stock from today onwards. :)
免責事項
これらの情報および投稿は、TradingViewが提供または保証する金融、投資、取引、またはその他の種類のアドバイスや推奨を意図したものではなく、またそのようなものでもありません。詳しくは利用規約をご覧ください。
免責事項
これらの情報および投稿は、TradingViewが提供または保証する金融、投資、取引、またはその他の種類のアドバイスや推奨を意図したものではなく、またそのようなものでもありません。詳しくは利用規約をご覧ください。