Overview:
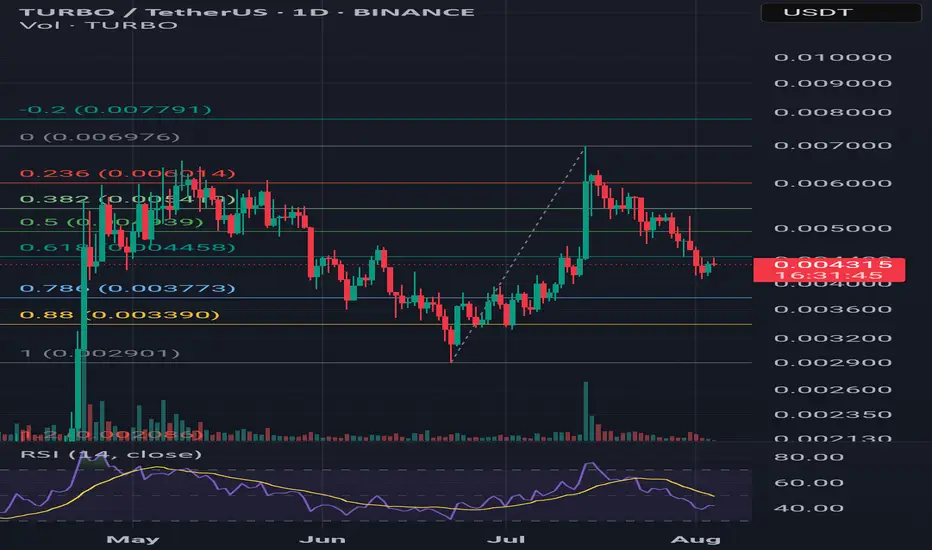
TURBO/USDT is potentially forming a textbook Cup and Handle pattern on the 1-day chart. Price action suggests a rounded bottom (the “cup”) followed by a consolidation range (the “handle”), setting up for a possible breakout.
---
🔍 Pattern Structure:
- Cup Formation:
Price rallied from ~0.0029 to ~0.0060 USDT, retracing slightly from the top. This rounded rise resembles the classic cup shape.
- Handle Formation:
Recent price consolidation between 0.0042–0.0049 USDT hints at the formation of the handle. A breakout above resistance could validate the pattern.
---
📈 Key Technical Levels:
Entry Zone | 0.0047 – 0.0050 |
| Resistance (Breakout)| ~0.0060 |
| Target 1 | ~0.0064 |
| Target 2 | 0.0078 – 0.0084 |
| Stop Loss | Below 0.0042 |
🔄 Additional Indicators:
- Volume: Watch for increasing volume to confirm breakout momentum.
- RSI (14-day): Neutral zone with room for upward movement. Momentum is building.
- Fibonacci Levels: 0.618 retracement (~0.004458 USDT) has acted as a key support during handle formation.
---
💡 Idea: Monitor for a daily close above 0.0060 with volume confirmation. That could mark the beginning of a bullish continuation. Risk management is essential if price fails to hold above the handle support.
免責事項
これらの情報および投稿は、TradingViewが提供または保証する金融、投資、取引、またはその他の種類のアドバイスや推奨を意図したものではなく、またそのようなものでもありません。詳しくは利用規約をご覧ください。
免責事項
これらの情報および投稿は、TradingViewが提供または保証する金融、投資、取引、またはその他の種類のアドバイスや推奨を意図したものではなく、またそのようなものでもありません。詳しくは利用規約をご覧ください。