$NDX #nasdaq100 same Divergence with RSI from January
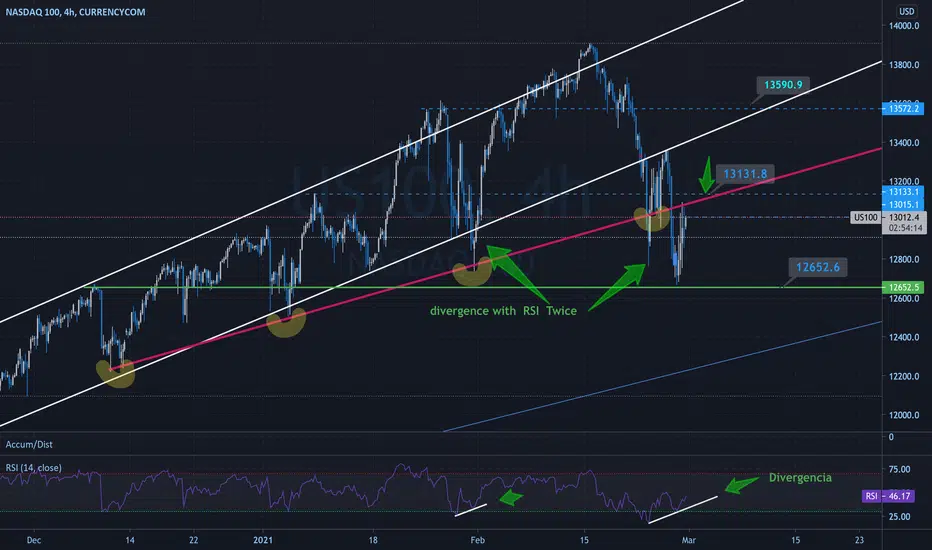
4h hours Chart is showing a divergence with the Relative Strength Index...
what do u think? bull or bear? NDX
NDX
what do u think? bull or bear?
免責事項
これらの情報および投稿は、TradingViewが提供または保証する金融、投資、取引、またはその他の種類のアドバイスや推奨を意図したものではなく、またそのようなものでもありません。詳しくは利用規約をご覧ください。
免責事項
これらの情報および投稿は、TradingViewが提供または保証する金融、投資、取引、またはその他の種類のアドバイスや推奨を意図したものではなく、またそのようなものでもありません。詳しくは利用規約をご覧ください。