検索
プロダクト
コミュニティ
マーケット
ブローカー
詳細
JA
始めましょう
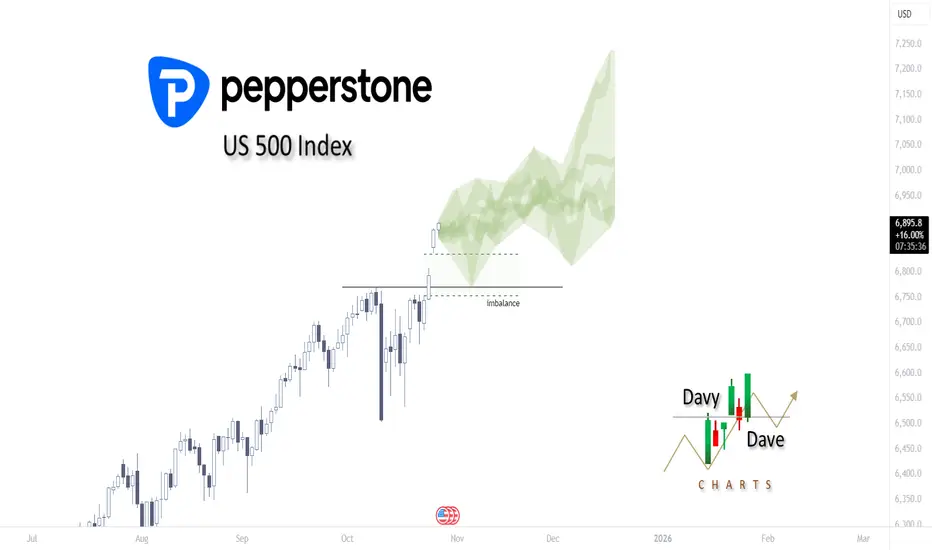
US 500 Index
ロング
昨日
What does history say about the rest of this year?
1
このチャートを取得
このチャートを取得
74
Taking a look at the US 500 Index and plotting the Late October to mid-December highs and lows on post-election year performances, the next two months are looking very bullish.
US500
SPY
SPX
VOO
Davy_Dave_Charts
フォロー
他のメディア:
Chart Patterns
Technical Indicators
Trend Analysis
免責事項
これらの情報および投稿は、TradingViewが提供または保証する金融、投資、取引、またはその他の種類のアドバイスや推奨を意図したものではなく、またそのようなものでもありません。詳しくは
利用規約
をご覧ください。
Chart Patterns
Technical Indicators
Trend Analysis
Davy_Dave_Charts
フォロー
他のメディア:
免責事項
これらの情報および投稿は、TradingViewが提供または保証する金融、投資、取引、またはその他の種類のアドバイスや推奨を意図したものではなく、またそのようなものでもありません。詳しくは
利用規約
をご覧ください。