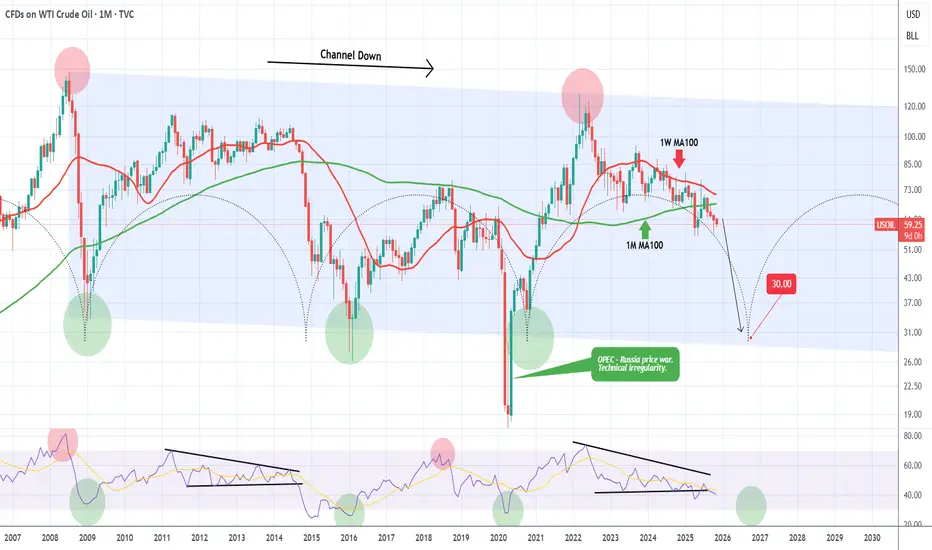
WTI Oil (USOIL) has been declining for 3 straight months (current red 1M candle is the 4th one) since the June 2025 rejection on the 1W MA100 (red trend-line). That has been the last rejection of a series of Lower Highs rejections on the 1W MA100 in the past 2 years.
On the much longer-term scale, this is the aftermath of the March 2022 market Top, made as a direct result of the Ukraine - Russia war. On a 17-year horizon, that was the 2nd Lower High of the multi-year Channel Down that WTI has been trading in since the July 2008 Top of the Housing Crisis.
As you can see, there is a high degree of symmetry on this pattern with Lower Lows in particular (market bottoms) getting formed around every 5-6 years. The use of the Time Cycles can fairly accurately project this. The next one is estimated to be towards the end of 2026, which matches perfectly the projected Bear Cycle bottom on the stock markets.
Based on this model, we may very well see WTI drop to as low as $30.00. A fairly solid bottom buy indicator would be when (if) the 1M RSI breaks below its 30.00 (oversold) barrier.
---
** Please LIKE 👍, FOLLOW ✅, SHARE 🙌 and COMMENT ✍ if you enjoy this idea! Also share your ideas and charts in the comments section below! This is best way to keep it relevant, support us, keep the content here free and allow the idea to reach as many people as possible. **
---
💸💸💸💸💸💸
👇 👇 👇 👇 👇 👇
👑Best Signals (Forex/Crypto+70% accuracy) & Account Management (+20% profit/month on 10k accounts)
💰Free Channel t.me/tradingshotglobal
🤵Contact info@tradingshot.com t.me/tradingshot
🔥New service: next X100 crypto GEMS!
💰Free Channel t.me/tradingshotglobal
🤵Contact info@tradingshot.com t.me/tradingshot
🔥New service: next X100 crypto GEMS!
免責事項
この情報および投稿は、TradingViewが提供または推奨する金融、投資、トレード、その他のアドバイスや推奨を意図するものではなく、それらを構成するものでもありません。詳細は利用規約をご覧ください。