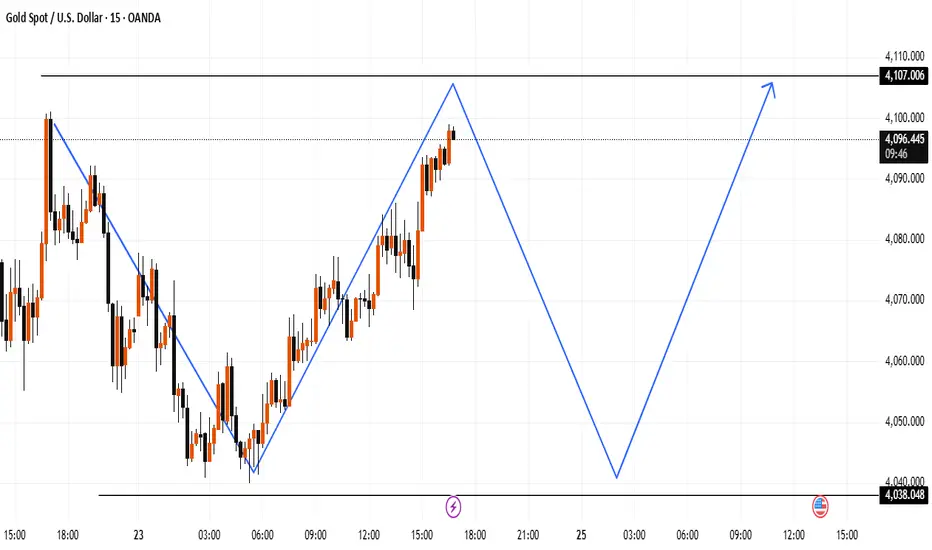
This chart highlights a possible short-term completion of the current upward leg, followed by a deeper corrective move toward the lower support zone near 4038, before a potential bullish continuation toward the 4107 area.
The projection is based on simple market structure:
Price has reached a previous reaction zone.
A corrective wave may form if rejection appears.
A new impulse could develop from the lower support level.
The projection is based on simple market structure:
Price has reached a previous reaction zone.
A corrective wave may form if rejection appears.
A new impulse could develop from the lower support level.
トレード稼働中
its time to trade active免責事項
この情報および投稿は、TradingViewが提供または推奨する金融、投資、トレード、その他のアドバイスや推奨を意図するものではなく、それらを構成するものでもありません。詳細は利用規約をご覧ください。
免責事項
この情報および投稿は、TradingViewが提供または推奨する金融、投資、トレード、その他のアドバイスや推奨を意図するものではなく、それらを構成するものでもありません。詳細は利用規約をご覧ください。