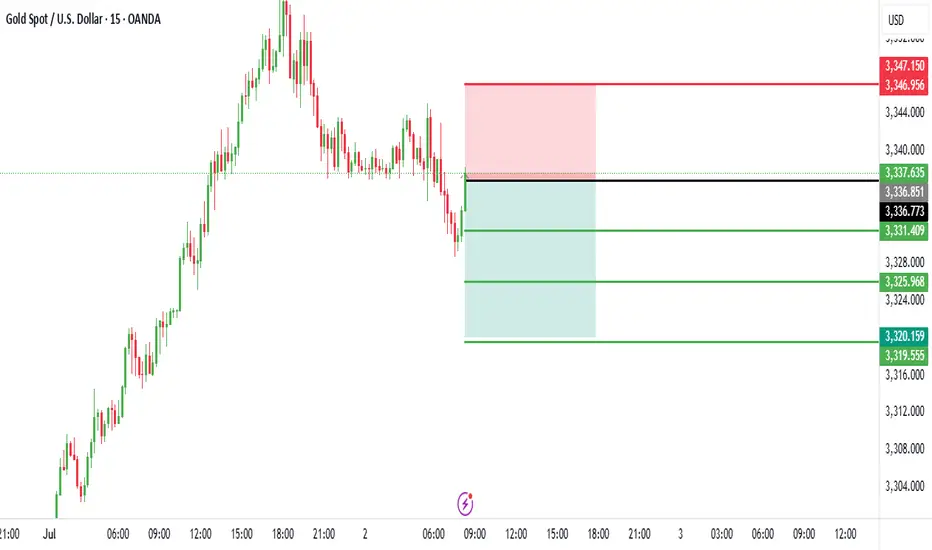
Based on the provided 15-minute chart for Gold Spot / U.S. Dollar (XAU/USD) and the specified data, here’s a suggested trading setup for a sell position:
Current Price and Trend: The current price is not explicitly provided, but the entry price is set at 3,336.00. The chart suggests a potential resistance zone near this level, with a recent uptrend showing signs of exhaustion.
Sell Entry: Enter a sell position at 3,336.00, aligning with the specified entry price where the price may face rejection due to resistance.
Stop Loss: Place a stop loss at 3,346.00, above the recent high, to protect against an upward breakout. This level is 10.00 points above the entry, defining the risk.
Take Profit Levels:
Take Profit 1: 3,331.00, a conservative target 5.00 points below the entry.
Take Profit 2: 3,326.00, a mid-range target 10.00 points below the entry.
Take Profit 3: 3,321.00, a deeper target 15.00 points below the entry, aligning with a potential support zone.
Price Action: The chart indicates a peak near the entry level, with a bearish reversal signal suggested by the candlestick pattern and resistance line.
Risk-Reward Ratio: The distance to the stop loss (10.00 points) compared to the take profit levels (5.00 to 15.00 points) offers a mixed risk-reward profile. Take Profit 2 and 3 provide a 1:1 and 1:1.5 ratio, respectively, making this a balanced short-term trade.
Conclusion
Enter a sell at 3,336.00, with a stop loss at 3,346.00 and take profit levels at 3,331.00, 3,326.00, and 3,321.00. Monitor the price action for confirmation of a downtrend, and be cautious of a potential upward move if the price breaks above the stop loss level.
トレード稼働中
TAKE PROFIT 1 HIT GUYS AND MOVE YOUR STOCK LOSS TO ENTERY.免責事項
これらの情報および投稿は、TradingViewが提供または保証する金融、投資、取引、またはその他の種類のアドバイスや推奨を意図したものではなく、またそのようなものでもありません。詳しくは利用規約をご覧ください。
免責事項
これらの情報および投稿は、TradingViewが提供または保証する金融、投資、取引、またはその他の種類のアドバイスや推奨を意図したものではなく、またそのようなものでもありません。詳しくは利用規約をご覧ください。