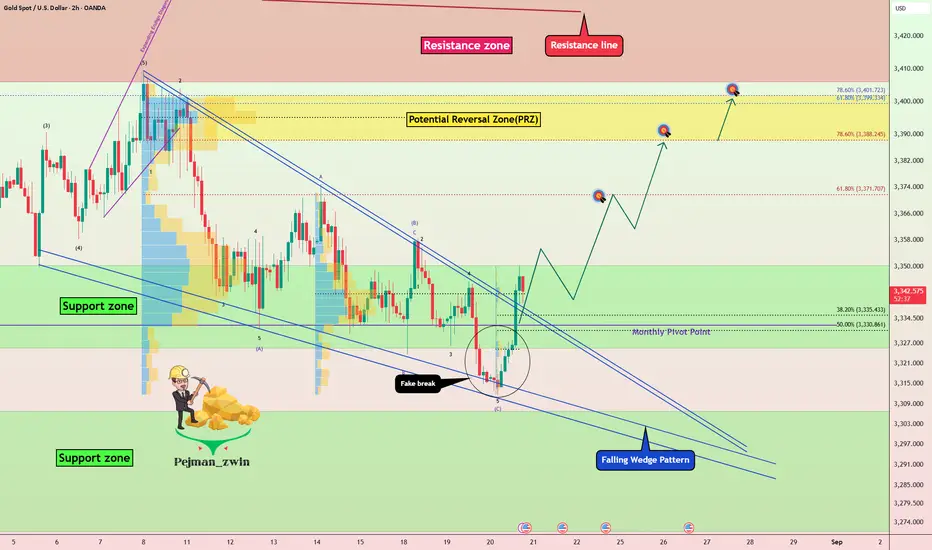
After creating a fake break below the Support zone($3,350-$3,326), Gold( XAUUSD) rose again above this zone and the Monthly Pivot Point.
If we look at the Gold chart on the 2-hour time frame from a Classic Technical Analysis perspective, we can see a falling reversal pattern, with Gold currently breaking the upper line of this pattern.
In terms of Elliott Wave theory, it seems that Gold is completing a corrective wave, and we should wait for the next impulse wave.
I expect Gold to start rising from the Support zone($3,350-$3,326) and rise to at least $3,369.
Second Target: Potential Reversal Zone(PRZ) = $3,402-$3,388
Note: Stop Loss (SL) = $3,320
Note: From today until Friday, important indexes will be released from the US, which can create excitement in financial markets, especially Gold, and even change the market trend when released.
FOMC Meeting Minutes = Today
Unemployment Claims = Tomorrow
Flash Manufacturing /Services PMI = Tomorrow
Fed Chair Powell Speaks = Friday
Gold Analyze (XAUUSD), 2-hour time frame.
Be sure to follow the updated ideas.
Do not forget to put a Stop loss for your positions (For every position you want to open).
Please follow your strategy; this is just my idea, and I will gladly see your ideas in this post.
Please do not forget the ✅ 'like' ✅ button 🙏😊 & Share it with your friends; thanks, and Trade safe.
トレード稼働中
Position was activated.Gold appears to have completed a pullback to the upper lines of the wedge pattern.
Considering the U.S. indexes that will be released today.
Unemployment Claims
Flash Manufacturing /Services PMI
ノート
Please Transfer Stop Loss(SL) 3351.381 USD トレード終了: 利益確定目標に到達
Full target Done
🎁Welcome than a 50% bonus(Low Spread)👉vtm.pro/Y3AV7r
🎁Get a 20% Discount on your trading FEE on BYBIT:👉partner.bybit.com/b/PEJMANZWIN
🎁Get a 20% Bonus & 30% Discount on LBANK exchange(NO KYC)👉lbank.one/join/uBythQd
🎁Get a 20% Discount on your trading FEE on BYBIT:👉partner.bybit.com/b/PEJMANZWIN
🎁Get a 20% Bonus & 30% Discount on LBANK exchange(NO KYC)👉lbank.one/join/uBythQd
関連の投稿
免責事項
これらの情報および投稿は、TradingViewが提供または保証する金融、投資、取引、またはその他の種類のアドバイスや推奨を意図したものではなく、またそのようなものでもありません。詳しくは利用規約をご覧ください。