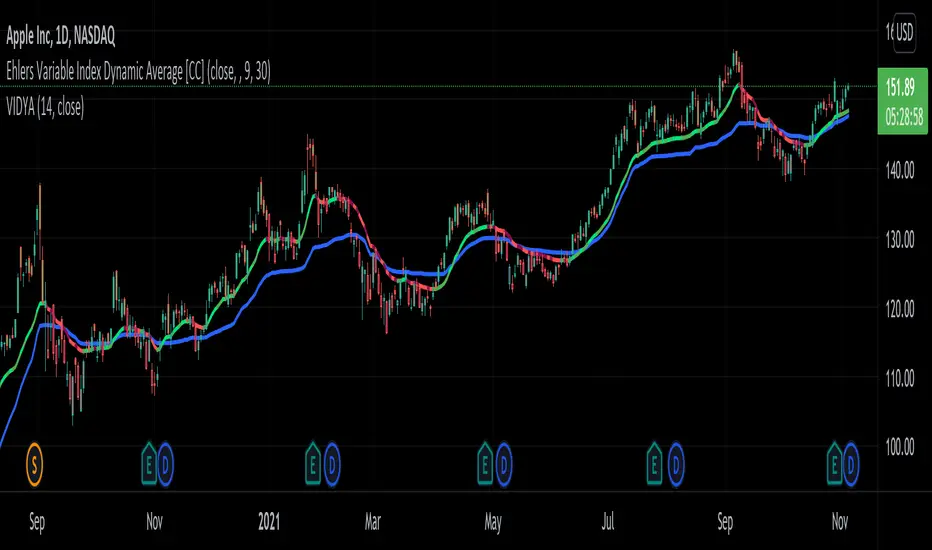
Ehlers Variable Index Dynamic Average [CC]The Variable Index Dynamic Average was created by Tushar Chande and this is a variation of that original formula created by John Ehlers. As you can see I have included the default Vidya from a script by @everget and as you can see the Ehlers version is able to follow the price much closer. I have included strong buy and sell signals in addition to normal ones and so darker colors are strong signals and lighter colors are normal ones. Buy when the line turns green and sell when it turns red.
Let me know if there are any other scripts you would like to see me publish!
John
Ehlers Cycle Period [CC]The Cycle Period was created by John Ehlers and this is yet another version that shows how to calculate the current cycle period which is the approximate amount of days between a current peak or valley and the next peak or valley. I would not recommend this for trading since it is more for informational use only but I would try experimenting with this output to be used with another indicator as an input length. I have included strong buy and sell signals in addition to normal ones so strong signals are darker in color and normal signals are lighter in color.
Let me know if there are any other scripts you would like to see me publish!

Ehlers Kaufman Adaptive Moving Average [CC]The Kaufman Adaptive Moving Average was created by Perry Kaufman and this is a variation of that original formula created by John Ehlers. I have included a side by side with an original script (blue line) done by @HPotter that shows that Ehlers version is slightly more reactive compared to the original version. I have included strong buy and sell signals in addition to normal ones and so darker colors are strong signals and lighter colors are normal ones. Buy when the line turns green and sell when it turns red.
Let me know if there are any other scripts you would like to see me publish!

Ehlers Mesa Spectrum Dominant Cycle [CC]The Mesa Spectrum Dominant Cycle was created by John Ehlers and this is the foundation for many indicators he created that would later follow. This is his updated version of his original Mesa algorithm and I do not recommend this indicator as a stand alone for trading. This is more of an informational indicator that will tell you the current dominant cycle period which is the approximate period between peaks and valleys in the underlying data. I have color coded buy signals just in case with both strong and normal signals. Darker colors are strong and lighter colors are normal. Buy when the line is green and sell when it is red.
Let me know if there are any other indicators you would like to see me publish!

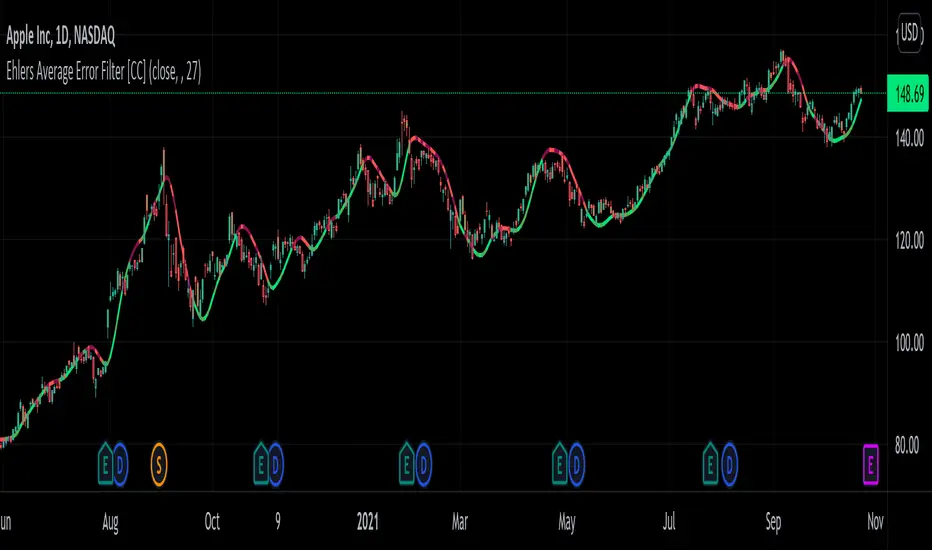
Ehlers Average Error Filter [CC]The Average Error Filter was created by John Ehlers and this is a variation of a Zero Lag Exponential Moving Average that uses a Super Smoother to filter out the noise and then uses a second Super Smoother of the difference between the current price and the filtered data. This works well as a trendline and does give out a few false signals like all indicators inevitably do but most signals do a good job of keeping up with the trend and providing clear entries and exits when the trend changes. I have included strong buy and sell signals in addition to normal ones so like always darker colors are strong signals and lighter colors are normal ones. Buy when the line turns green and sell when it turns red.
Let me know if there are any other scripts you would like to see me publish!
Ehlers Error Correcting Exponential Moving Average [CC]The Error Correcting Exponential Moving Average was created by John Ehlers and Ric Way (Stocks & Commodities V. 28:11 (30-35)) and this is an excellent moving average that accurately identifies the trend and sticks with the price during trends or choppy periods pretty well. It looks back to find the best gain setting for each day that returns the smallest difference between the current price and the ema based on the gain setting and uses that day's info in it's total calculations and if there is a zero gain for the day then it is just a classic ema. I have included strong buy and sell signals in addition to normal ones so lighter colors are normal and darker colors are strong. Buy when the line turns green and sell when it turns red.
Let me know if there are any other indicators you would like to see me publish!

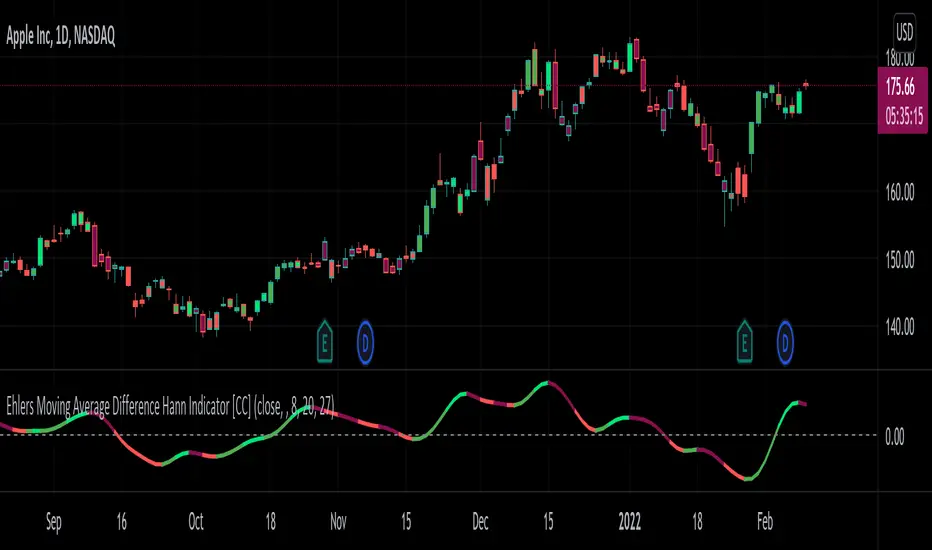
Ehlers Moving Average Difference Hann Indicator [CC]The Moving Average Difference Hann Indicator was created by John Ehlers (Stocks and Commodities Nov 2021) and this is an improved variation of his Moving Average Difference Indicator that uses smoothing from his Hann Windowing Indicator to provide smoother buy and sell signals. As for how this indicator works it is an improved version of the classic MACD indicator which of course takes a difference between two exponential moving averages. I have included strong buy and signals in addition to normal ones so lighter colors are normal signals and darker colors are strong signals. Buy when the line turns green and sell when it turns red.
Let me know if there are any other indicators you would like to see me publish!
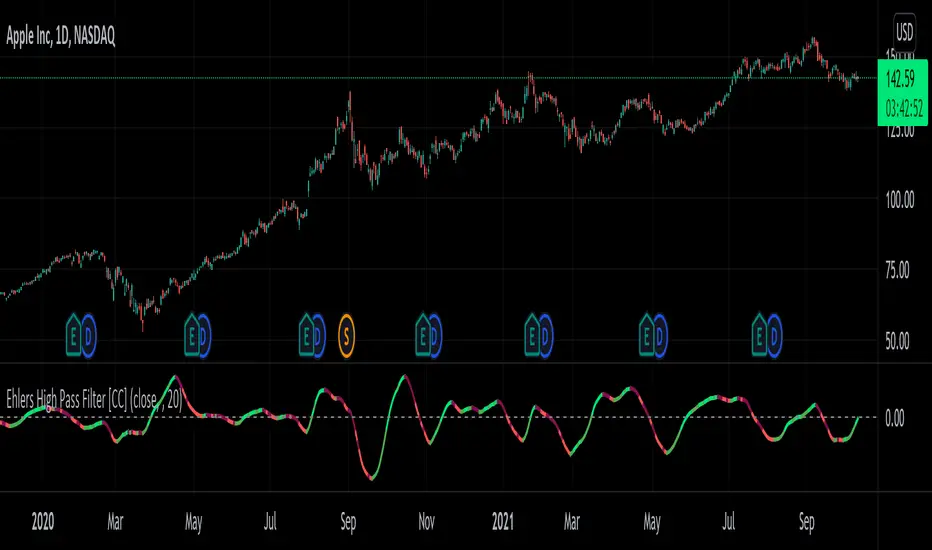
Ehlers High Pass Filter [CC]The High Pass Filter was created by John Ehlers and I would define this indicator as both a momentum indicator but also a predictor indicator. This does a pretty good job of predicting future price action even though I have double smoothed it to provide clear buy and sell signals. I will be publishing quite a few more Ehlers indicators very soon so stay tuned. This indicator can be interpreted in a few different ways but most importantly it is a mid to long term sell signal when the indicator falls below the zero line and vice versa. It also falls below the zero line when the underlying price data starts losing momentum so it can be used also as a price reversal. I have included strong buy and sell signals in addition to normal ones so darker colors are strong signals and lighter colors are normal signals. Buy when the line turns green and sell when it turns red.
Let me know if there are any other indicators you would like to see me publish!
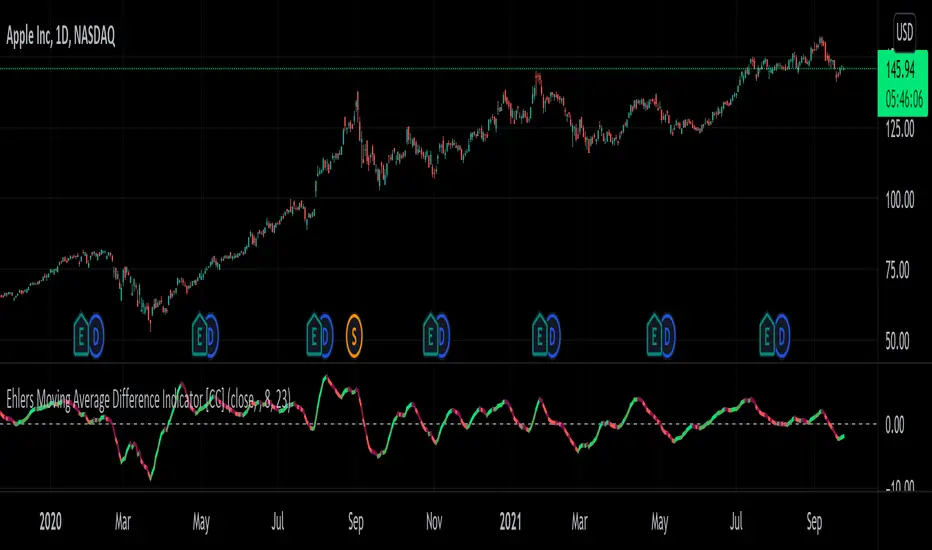
Ehlers Moving Average Difference Indicator [CC]The Moving Average Difference Indicator was created by John Ehlers (Stocks and Commodities Oct 2021 pg 23) and this is essentially his version of the famous MACD indicator. He calls this indicator the "thinking mans" MACD because his thought process for creating the lengths is based on half of the period of the dominant cycle. These are the default lengths that he created but feel free to test it out with your own variations and please let me know if you come up with a better one. I'm sorry for my long delay from TV. Sometimes I just need to step away and collect my thoughts before I burn myself out with the many scripts I keep publishing daily. I will try to get back into publishing daily again because I have a personal backlog of over 50 scripts ready to go that I haven't published yet. As always I have included strong buy and sell signals in addition to normal ones so darker colors are strong and lighter colors are normal. Buy when the line turns green and sell when it turns red.
Let me know if there are any other scripts you would like to see me publish!
Ehlers Cycle Amplitude [CC]The Cycle Amplitude was created by John Ehlers (Trend Modes and Cycle Modes) and this indicator wasn't meant to give buy and sell signals by itself but I'm publishing this open source script in case someone comes up with a cool way to use this indicator for buy and sell signals. This indicator essentially tells you the distance between the peaks from the Cycle BandPass Filter and I will be including the last script tomorrow most likely. I'm reusing the same exact buy and sell signals from the cycle bandpass filter so if you have any questions then feel free to refer to the link I posted.
Let me know if there are any other scripts you would like to see me publish!

Ehlers Cycle BandPass Filter [CC]The Cycle BandPass Filter was created by John Ehlers (Cycle Modes and Trend Modes) and this is an alternate to the default BandPass Filter by changing some settings. This will be another series I will be introducing showing some indicators created by Ehlers and that didn't get much attention. This identifies the underlying cycle in the price data and these indicators aren't very common so I want to introduce more of these to tv. Buying and selling with these indicators can be a bit tricky but overall what Ehlers recommends is to buy at the lowest point and sell at the highest point to capture the underlying cycle. I have included strong buy and sell signals as darker colors and normal signals as lighter colors. Buy when the line turns green and sell when it turns red.
Let me know if there are any other scripts you would like to see me publish!

Ehlers Instantaneous Phase Dominant Cycle [CC]The Instantaneous Phase Dominant Cycle was created by John Ehlers (Stocks & Commodities V. 18:3 (16-27)) and this is one of many similar indicators that I will be publishing from Ehlers in the next few months that calculate the current dominant cycle period. The cycle period can be used in multiple ways but generally this means that if the stock is currently at a low then the current cycle period will tell you when the next lowest low will get hit or vice versa. This is also useful for using this cycle period as an input for other indicators to provide a very good adaptive length. Let me know how you wind up using these indicators in your daily trading. I have included the same buy and sell signals from my recent Hilbert Transform and so buy when the line turns green and sell when it turns red.
Let me know if there are any other indicators you would like to see me publish!

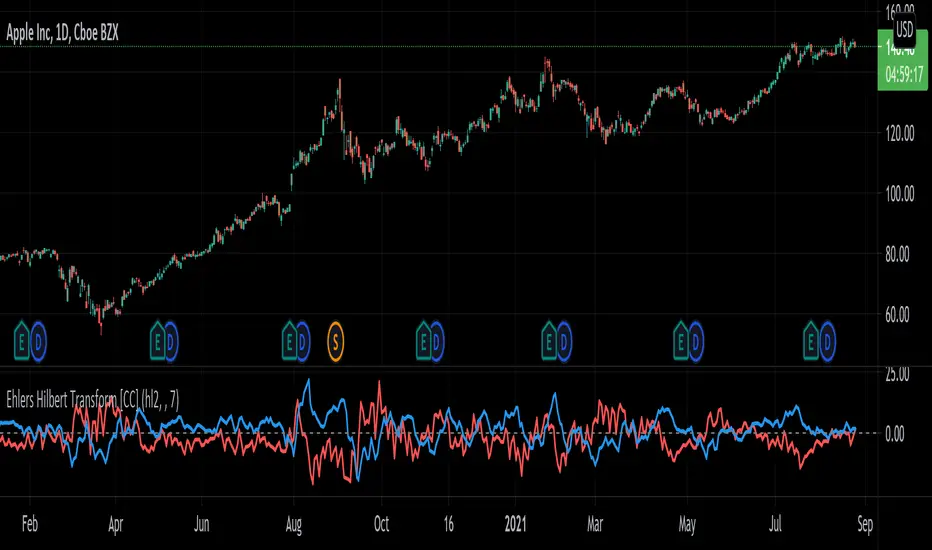
Ehlers Hilbert Transform [CC]The Hilbert Transform was created by John Ehlers (Stocks & Commodities V. 18:3 (16-27)) and this indicator can work pretty well as a trend confirmation. This essentially transforms the underlying price data into a soundwave and when you compare the two (blue is positive and red is negative) then it provides fairly clear buy and sell signals. Ehlers did warn in his original article that this indicator has a lag of 4 bars so you have to keep that in mind. I have found that this indicator works pretty well when you buy when the blue line goes over the red line and sell when the blue lines hits the zero line. You could also ignore the red line and buy when the blue line crosses over the zero line and sell when it crosses under. Let me know how you wind up using this indicator in your trading.
Let me know if there are any other scripts you would like to see me publish!
Ehlers Squelch Indicator [CC]The Squelch Indicator was created by John Ehlers (Stocks & Commodities V. 18:9 (42-46)) and this indicator is a variation of his Market Mode Indicator and its purpose is the same as in it determines if the market is trending or in a choppy market. If this indicator is at the 1 level then this means the market is trending and if it is at 0 then the market is choppy. I would recommend to adjust the squelch variable to find a setting that works well for you. If you want to avoid more choppy markets then adjust the squelch variable to a lower amount and vice versa. I have included basic buy and sell signals so buy when the line turns green and sell when it turns red.
Let me know if there are any other indicators you would like to see me publish!

Ehlers Simple Window Indicator [CC]The Simple Window Indicator was created by John Ehlers (Stocks and Commodities Sep 2021) and this is the last of the 4 new indicators that he published in the latest issue of Stocks & Commodities. Since these are all part of a series, the idea behind each indicator is the exact same. The only difference is of course the calculation for each indicator. This script is different mostly because it is extremely noisy in comparison so I had to smooth it twice to provide clear buy and sell signals. Window functions are used in digital signal processing to filter out noise and the end result is an oscillator that centers around the 0 line. The easy way to understand these indicators that I will be publishing and those are that when they are above 0, it usually means an uptrend and below 0 then a downtrend. For more immediate signals, I have included both normal and strong buy and sell signals so darker colors for strong signals and lighter colors for normal signals. Buy when the line turns green and sell when it turns red.
Let me know if there are any other indicators you would like me to publish!

Ehlers Triangle Window Indicator [CC]The Triangle Window Indicator was created by John Ehlers (Stocks and Commodities Sep 2021) and this is one of 4 new indicators that he published in the latest issue of Stocks & Commodities and I will be publishing the last one tomorrow. Since these are all part of a series, the idea behind each indicator is the exact same. The only difference is of course the calculation for each indicator. Window functions are used in digital signal processing to filter out noise and the end result is an oscillator that centers around the 0 line. The easy way to understand these indicators that I will be publishing and those are that when they are above 0, it usually means an uptrend and below 0 then a downtrend. For more immediate signals, I have included both normal and strong buy and sell signals so darker colors for strong signals and lighter colors for normal signals. Buy when the line turns green and sell when it turns red.
Let me know if there are any other indicators you would like me to publish!

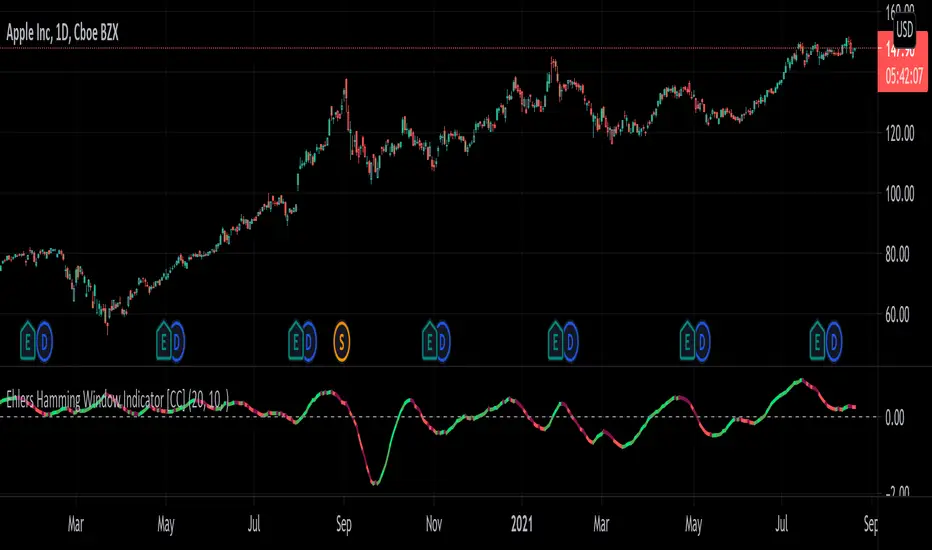
Ehlers Hamming Window Indicator [CC]The Hamming Window Indicator was created by John Ehlers (Stocks and Commodities Sep 2021) and this is one of 4 new indicators that he published in the latest issue of Stocks & Commodities and I will be publishing the other 2 in the next few days. Since these are all part of a series, the idea behind each indicator is the exact same. The only difference is of course the calculation for each indicator. Window functions are used in digital signal processing to filter out noise and the end result is an oscillator that centers around the 0 line. The easy way to understand these indicators that I will be publishing and those are that when they are above 0, it usually means an uptrend and below 0 then a downtrend. For more immediate signals, I have included both normal and strong buy and sell signals so darker colors for strong signals and lighter colors for normal signals. Buy when the line turns green and sell when it turns red.
Let me know if there are any other indicators you would like me to publish!
Ehlers Hann Window Indicator [CC]The Hann Window Indicator was created by John Ehlers (Stocks & Commodities Sep 2021) and this is one of 4 new indicators that he published in the latest issue of Stocks & Commodities and I will be publishing the other 3 in the next few days. Since these are all part of a series, the idea behind each indicator is the exact same. The only difference is of course the calculation for each indicator. Window functions are used in digital signal processing to filter out noise and the end result is an oscillator that centers around the 0 line. The easy way to understand these indicators that I will be publishing and those are that when they are above 0, it usually means an uptrend and below 0 then a downtrend. For more immediate signals, I have included both normal and strong buy and sell signals so darker colors for strong signals and lighter colors for normal signals. Buy when the line turns green and sell when it turns red.
Let me know if there are any other indicators you would like me to publish!

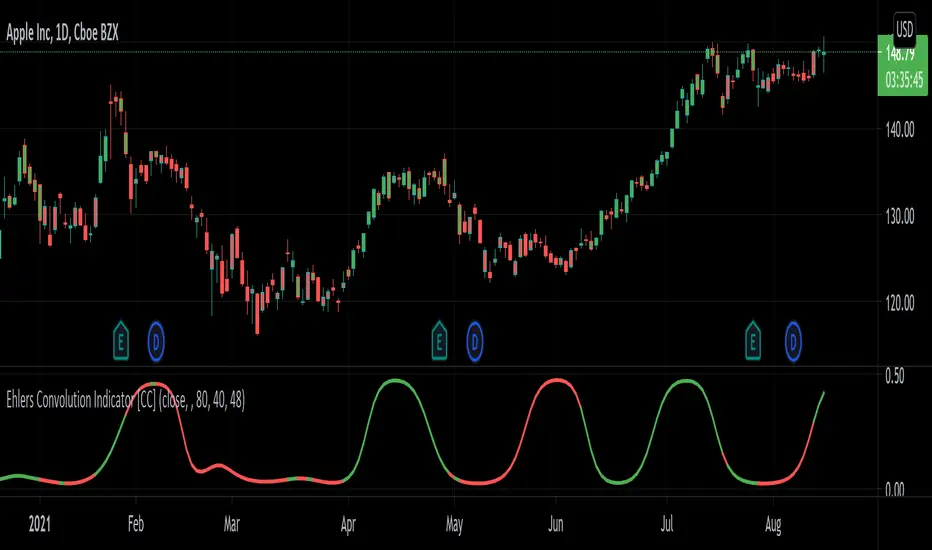
Ehlers Convolution Indicator [CC]The Convolution Indicator was created by John Ehlers (Cycle Analytics For Traders pgs 170-174) and this is version of an indicator to find potential reversal points. The idea behind this indicator is to use a variation of his AutoCorrelation Indicator that transforms the data using digital signal processing and as you can see it looks very similar to his BandPass Filter . The idea is that when this indicator peaks then it has reached a potential reversal point and so the stock may continue in the current direction but most of the time this indicator correctly points out the reversal points. I have included normal buy and sell signals but generally speaking you would want to buy when the indicator is around 0.05 to 0.10 and moving up and sell when it reaches its peak and is starting to move down.
Let me know if you have any other scripts you would like to see me publish!
Ehlers Optimum Predictor [CC]The Optimum Predictor was created by John Ehlers (Rocket Science For Traders pgs 209-210) and this indicator does a pretty good job of predicting major market moves. When the blue line crosses over the red line then this indicator is predicting an upcoming uptrend and when the blue line crosses under the red line then it is predicting an upcoming downtrend. Ehlers recommends using this indicator with an entire trading system to filter out any bad signals but most of the signals it gives are pretty accurate. He uses advanced digital signal processing to predict the future prices and uses it in an ema formula for the calculation. There are several ways to interpret this indicator: you can look for crossovers, you can also look for when the indicator goes above 0 for a general uptrend or below 0 for a general downtrend.
Let me know if there are any other scripts you would like to see me publish!

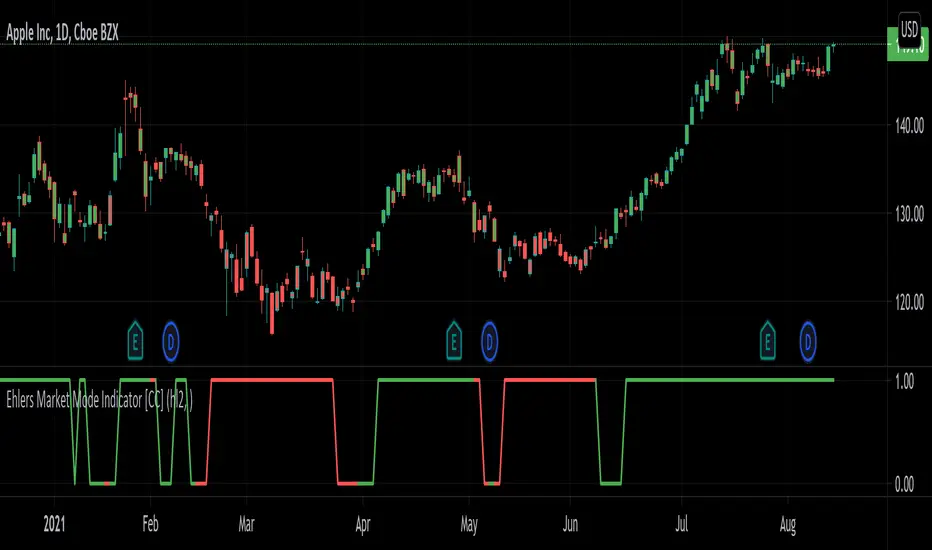
Ehlers Market Mode Indicator [CC]The Market Mode Indicator was created by John Ehlers (Rocket Science For Traders pgs 114-117) and this is a handy tool that will tell you if the market is currently in a cycle or a trend. When the current market is in a cycle or choppy state then the indicator will read 0 and when it is in a trend then it will read 1. He uses some advanced digital signal processing to figure out the current trend and for how long it has been trending. I have included buy and sell signals using the trendline and so buy when the line turns green and sell when it turns red. Let me know if this indicator is useful for you.
Let me know if there are any other indicators you would like to see me publish!
Ehlers Relative Vigor Index [CC]The Relative Vigor Index was created by John Ehlers (Cybernetic Analysis For Stocks And Futures pg 58) and this is a momentum indicator that is similar to the Accumulation Distribution Oscillator created by Jim Waters and Larry Williams. He uses digital signal processing to smooth the indicator to provide clear buy and sell signals. The idea behind this indicator is that during uptrends, prices tend to close near the high and during downtrends, prices tend to close near the low. I have included strong buy and sell signals in addition to normal ones so strong signals are darker in color and normal ones are lighter in color. Buy when the line turns green and sell when it turns red. Usually the best signals I have found for this indicator is when the indicator is below the 0 line and turns green then it is usually a sign of a strong uptrend.
Let me know if there are any other scripts you would like to see me publish!

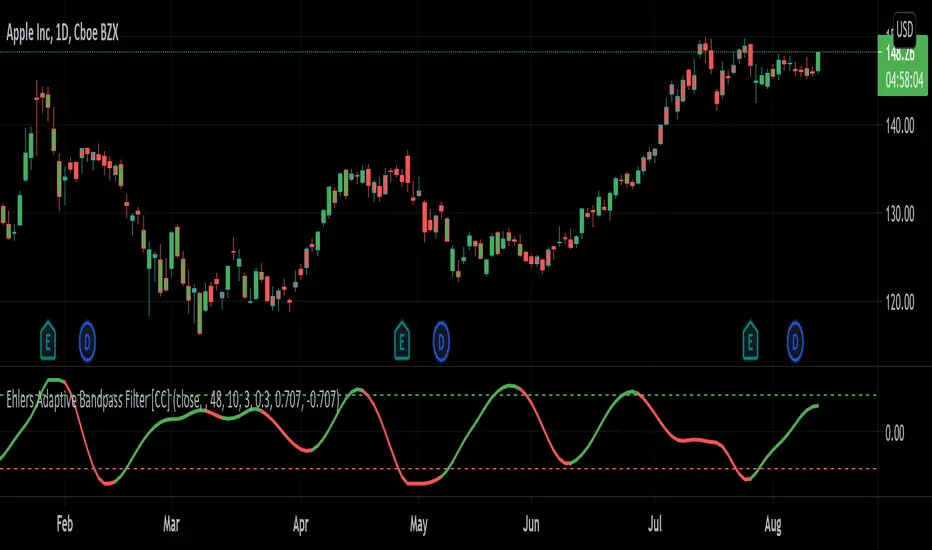
Ehlers Adaptive Bandpass Filter [CC]The Adaptive Bandpass Filter was created by John Ehlers (Cycle Analytics For Traders pgs 153-156) and this uses his autocorrelation code to provide the adaptive lengths to use for the underlying bandpass filter. The bandpass filter is a common way in digital signal processing to filter out the underlying noise in the data. It can actually be turned into a leading indicator by changing the bw variable to a smaller amount. Since this indicator is adaptive using the cycle period, the buy and sell signals are different compared to the normal bandpass filter. Buy signals for this indicator according to Ehlers are when the line is red and the line is under the oversold line (also red) then you buy when the indicator line turns green and then you exit when the indicator line turns red and is above the overbought line. This indicator doesn't provide clear buy and sell signals in all circumstances but generally speaking buy when the indicator line turns green and sell when it turns red. Feel free to experiment with this one.
Let me know if there are any other scripts you would like to see me publish!