Ehlers Fisher Stochastic Center Of Gravity [CC]The Fisher Stochastic Center Of Gravity Indicator was created by John Ehlers (Cybernetic Analysis For Stocks And Futures pg 95) and this is a combo cycle indicator mixed with a stochastic indicator. The idea is to capture the beginning of the cycle and ride it until the end. Buy when the indicator line is green and sell when it turns red.
This was a custom request so let me know if you would like to see me publish any other scripts or if you want something custom done!
John

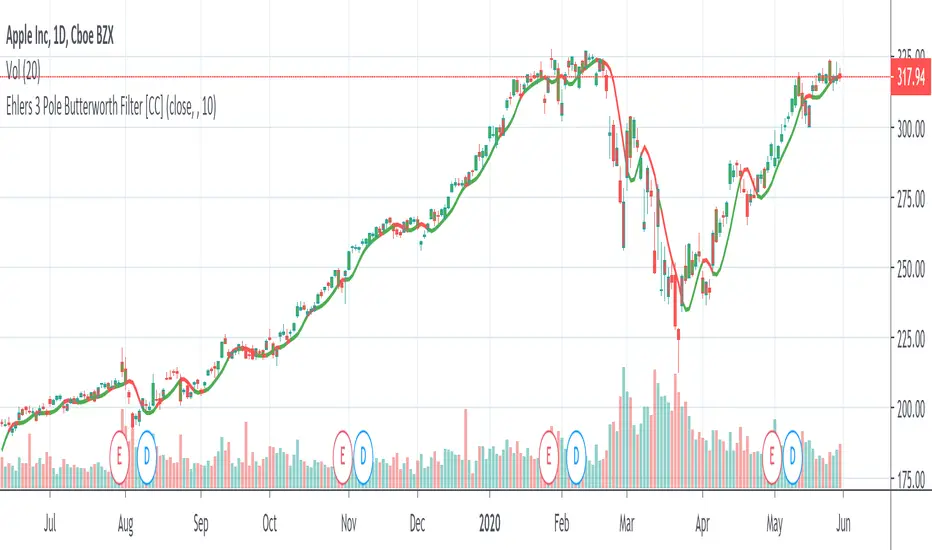
Ehlers 3 Pole Butterworth Filter [CC]The 3 Pole Butterworth Filter was created by John Ehlers (Cycle Analytics For Traders pg 32) and this is a nice filter that follows the price very closely. Buy when the indicator is green and sell when it turns red.
This was a custom request so let me know if you would like me to publish any other scripts or if you want something custom done!
Ehlers Fisher Transform Indicator [CC]The Fisher Transform Indicator was created by John Ehlers and the beauty of this indicator is that it provides sharp and clear turning points that are also very early. Buy when the indicator line is green and sell when it is red.
This was a special request so let me know if you would like me to publish other scripts or if you want something custom done!

Ehlers Market State Indicator [CC]The Market State Indicator was created by John Ehlers (Stocks & Commodities V. 38:06 (8–15)) and this is technically part of three indicators in one so I'm splitting each one to a separate script. This particular indicator was designed for the market state which acts as a trend direction and tells you whether the trend is strong in either direction. Keep in mind that when the indicator rapidly switches then the market is choppy and when it is a steady line then it is a very strong trend. Essentially buy when the indicator line is green and sell when it is red.
Let me know if you would like me to publish other scripts or if you want something custom done!
Note: I'm republishing this because the original script couldn't be found in searches so this will fix that.

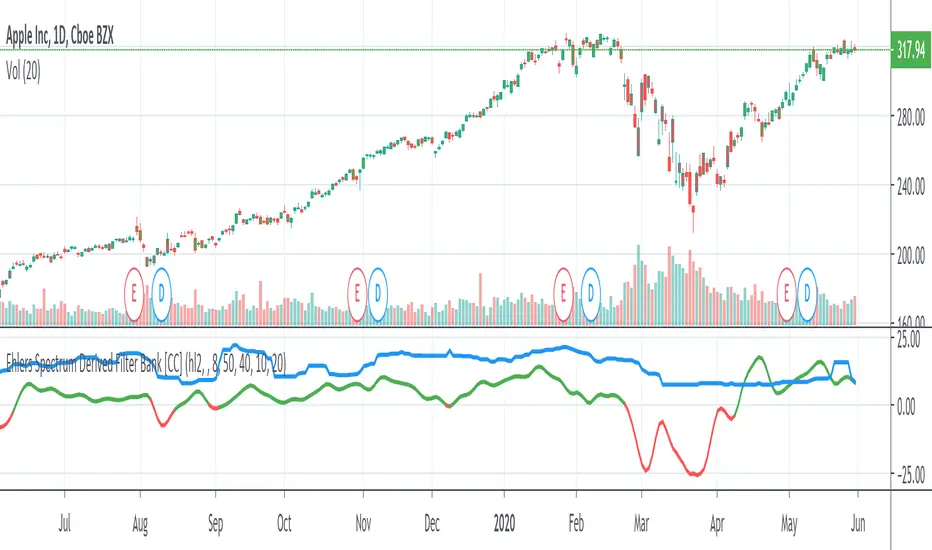
Ehlers Spectrum Derived Filter Bank [CC]The Spectrum Derived Filter Bank was created by John Ehlers (Stocks & Commodities V. 26:3 (16-22)) and this is technically two indicators in one. This will let you know the current cycle period which is in blue and the other indicator will let you know if you should buy the stock or not. Buy when it is green and sell when it is red.
Let me know if you would like me to publish other scripts or if you want something custom done!
Note: I'm republishing this because the original script couldn't be found in searches so this will fix that.
Ehlers Dominant Cycle Tuned Bypass Filter [CC]The Dominant Cycle Tuned Bypass Filter was created by John Ehlers (Stocks & Commodities V. 26:3 (16-22)) and this is a particularly unique indicator because this does a pretty good job at predicting the future stock movements. If the blue line crosses over the red then a few bars from now the stock price will most likely go up and if the blue line crosses below the red then a few bars from now the stock price should go down. Since this is such a unique indicator to use with entry and exit points, I don't have them color coded but try this out and let me know what you think.
This was a special request so let me know what other scripts you would like to see me publish or if you want anything custom done!
Note: I'm republishing this because the original script couldn't be found in searches so this will fix that.

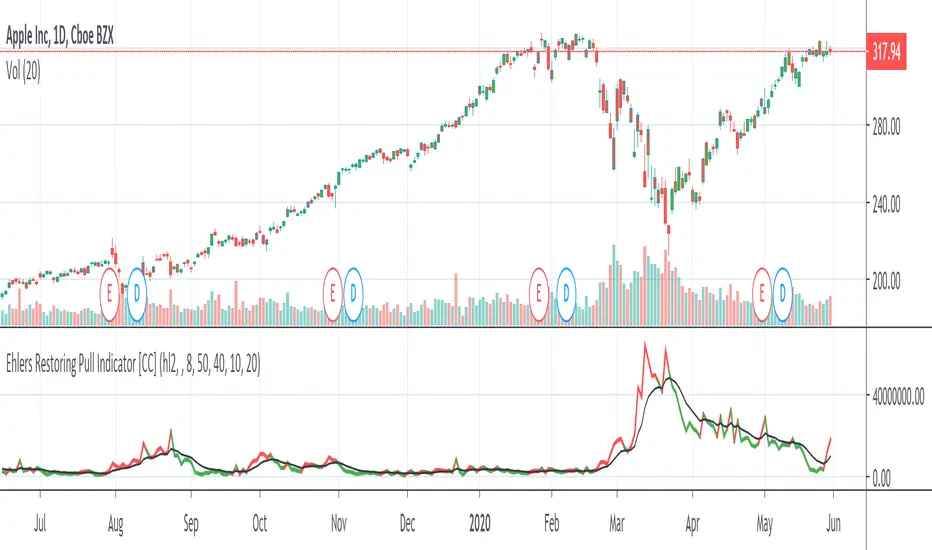
Ehlers Restoring Pull Indicator [CC]The Restoring Pull Indicator was created by John Ehlers (Stocks & Commodities V.11:10 (395-400)) and this was one of his earliest indicators that functions as a momentum indicator . Buy when the indicator line is green and sell when it is red.
Let me know if you would like to see me publish more scripts or if you want something custom done!
Note: I'm republishing this because the original script couldn't be found in searches so this will fix that.
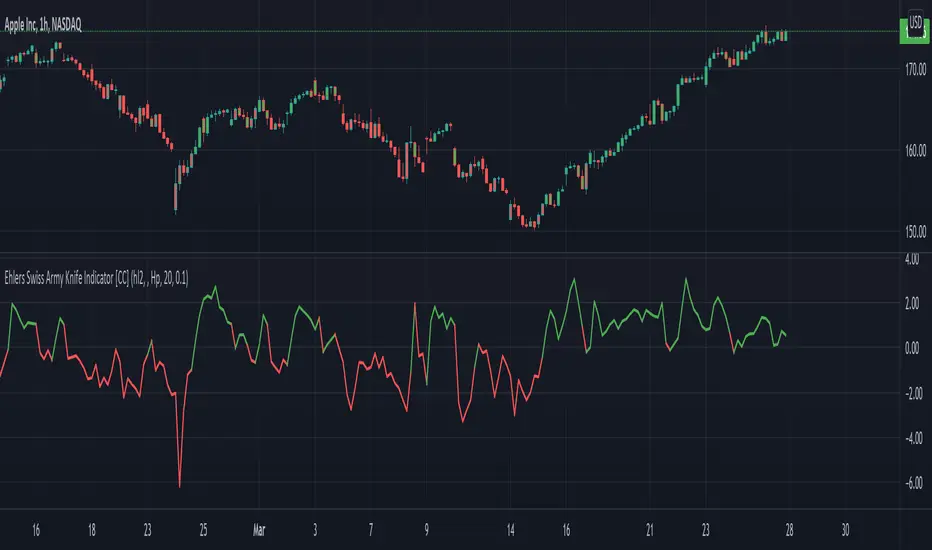
Ehlers Swiss Army Knife Indicator [CC]The Swiss Army Knife Indicator was created by John Ehlers (Stocks & Commodities V. 24:1 (28-31, 50-53)) and it is 9 different filters in one big mega indicator! This is my first attempt at allowing you all to select different timeframes, to choose if you allow repainting or not, or by letting you choose which indicator you want to see on the chart. I know this may cause problems so feel free to send me a pm if you are stuck or if you have any questions!
This was a custom request so please let me know if you want to see me publish any other scripts or if you want something custom done!
Note: I'm republishing this because the original script couldn't be found in searches so this will fix that.
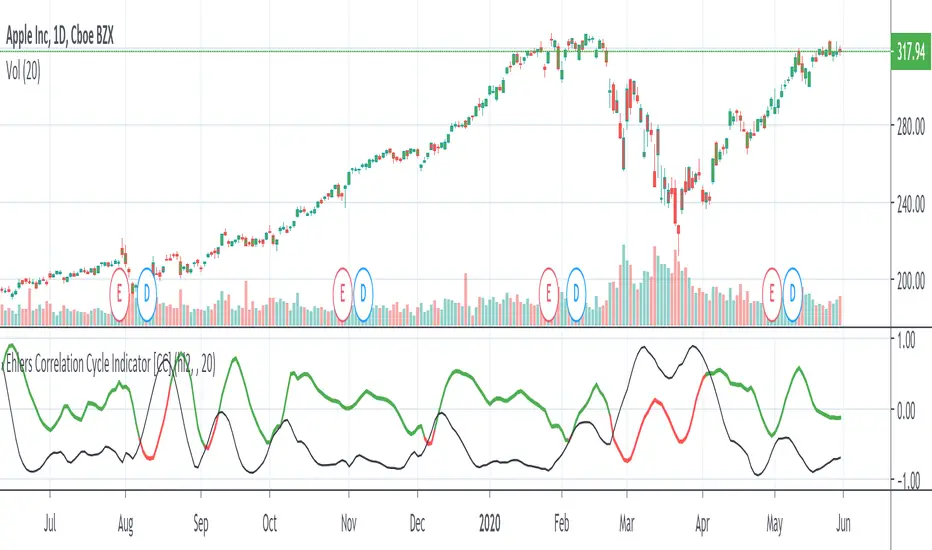
Ehlers Correlation Cycle IndicatorThe Correlation Cycle Indicator was created by John Ehlers (Stocks & Commodities V. 38:06 (8–15)) and this is technically part of three indicators in one so I'm splitting each one to a separate script. This particular indicator was designed for trend direction and trend strength and simply buy when it is green and sell when it turns red. Also keep in mind that the higher the indicator is above the signal then the stronger the trend and when they are close together, conditions get choppy.
Let me know if you would like to see me publish other scripts or if you want something custom done!
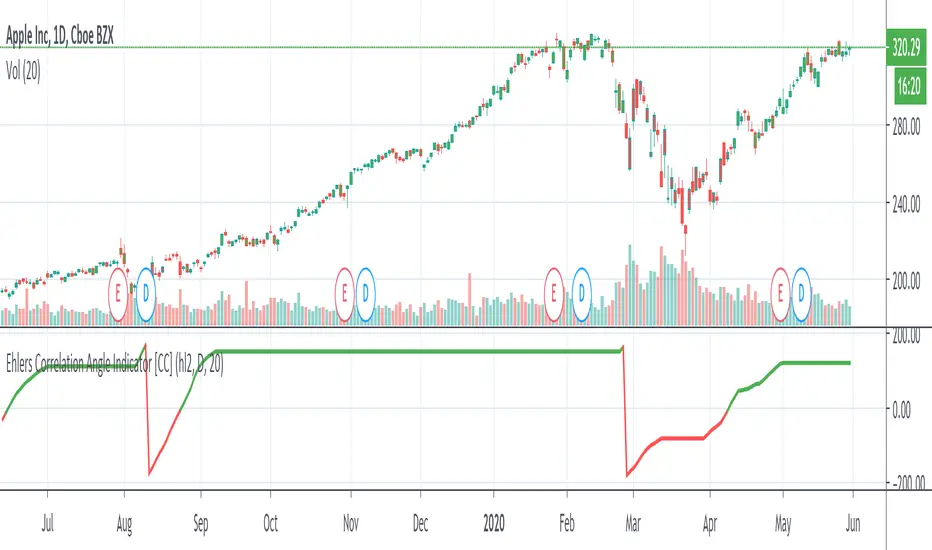
Ehlers Correlation Angle IndicatorThe Correlation Angle Indicator was created by John Ehlers (Stocks & Commodities V. 38:06 (8–15)) and this is technically three indicators in one so I'm splitting each one to a separate script. This particular indicator was designed for trend termination and simply buy when it is green and sell when it turns red.
Let me know if you would like to see me publish other scripts or if you want something custom done!
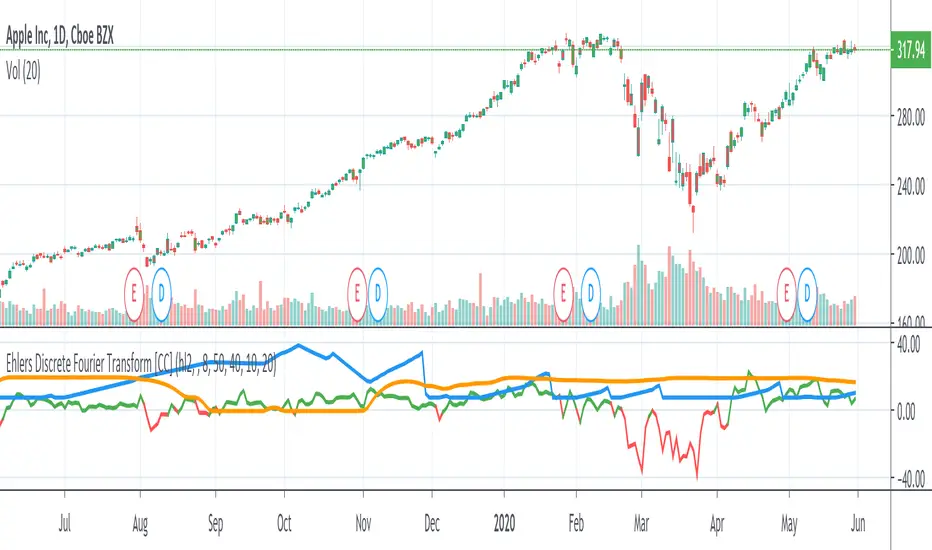
Ehlers Discrete Fourier TransformThe Discrete Fourier Transform Indicator was written by John Ehlers and more details can be found at www.mesasoftware.com
I have color coded everything as follows: blue line is the dominant cycle, orange line is the power converted to decibels, and I have marked the other line as red if you should sell or green if you should buy
Let me know if you would like to see me write any other scripts!
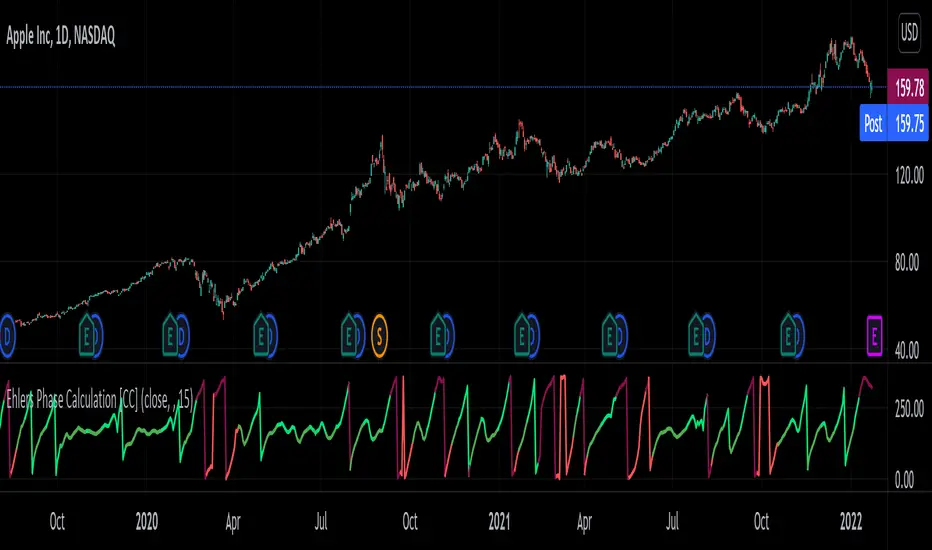
Phase CalculationPhase Calculation was authored by John F. Elders in the Stocks and Commodities Magazine 11/1996
This indicator will tell you if the stock is in a uptrend or downtrend. A phase number with a low number means it is in a uptrend and a phase number with a high number means it is in a downtrend.
Let me know if you want to see me write code for different indicators!
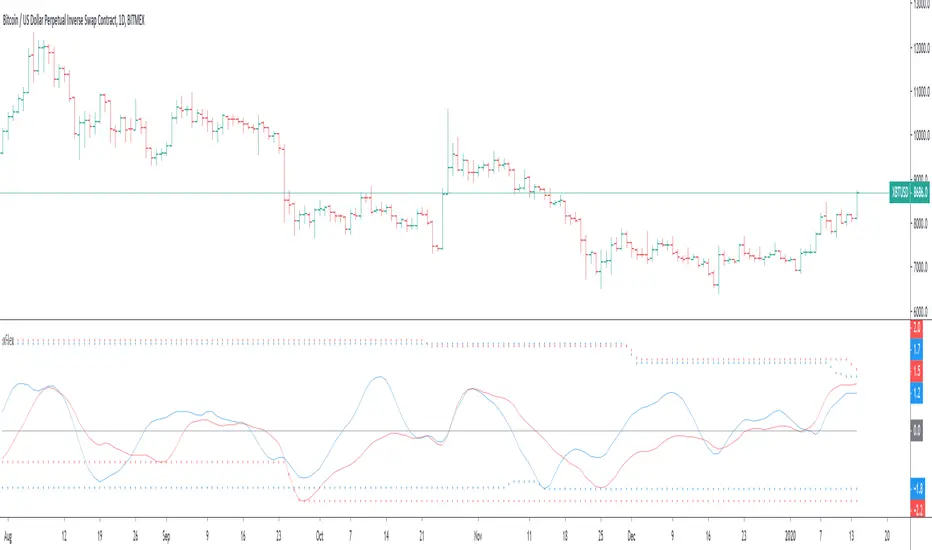
[e2] Reflex & TrendflexNew Indicator from John F. Ehlers issued in the February 2020 Technical Analysis of Stocks and Commodities article "Reflex: A New Zero-Lag Indicator"
This indicator includes both studies described in the article and intend to significantly reduce the lag of the signal compared to other oscillators.
Reflex for the cycle component and is more sensitive to major reversals, Trendflex for the trend component.
Pivot Max range as the borders for top and bottom reading of the indicators (the script will plot separate borders for both components) and divergences were added.
Divergence function is the interpretation of built-in divergence script, optimized the code and added option to show real-time divs (without offset), all credits to ...)
daily*tip: I must say that very quickly I began to realize how fragmented and imperfectly modern economic knowledge is and how little can be taken from fundamental science in terms of practical recipes. (c) Andrey Movchan.
stay safe ;)
Combo Backtest 123 Reversal & Detrended Synthetic Price V 2 This is combo strategies for get a cumulative signal.
First strategy
This System was created from the Book "How I Tripled My Money In The
Futures Market" by Ulf Jensen, Page 183. This is reverse type of strategies.
The strategy buys at market, if close price is higher than the previous close
during 2 days and the meaning of 9-days Stochastic Slow Oscillator is lower than 50.
The strategy sells at market, if close price is lower than the previous close price
during 2 days and the meaning of 9-days Stochastic Fast Oscillator is higher than 50.
Second strategy
Detrended Synthetic Price is a function that is in phase with the
dominant cycle of real price data. This DSP is computed by subtracting
a half-cycle exponential moving average (EMA) from the quarter cycle
exponential moving average.
See "MESA and Trading Market Cycles" by John Ehlers pages 64 - 70.
WARNING:
- For purpose educate only
- This script to change bars colors.
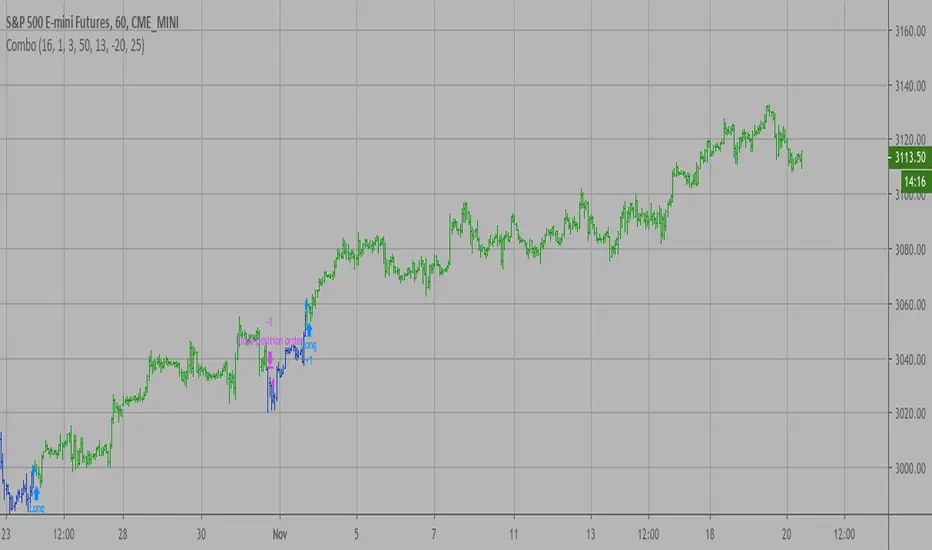
Combo Backtest 123 Reversal & D_DSP (Detrended Synthetic Price) This is combo strategies for get a cumulative signal.
First strategy
This System was created from the Book "How I Tripled My Money In The
Futures Market" by Ulf Jensen, Page 183. This is reverse type of strategies.
The strategy buys at market, if close price is higher than the previous close
during 2 days and the meaning of 9-days Stochastic Slow Oscillator is lower than 50.
The strategy sells at market, if close price is lower than the previous close price
during 2 days and the meaning of 9-days Stochastic Fast Oscillator is higher than 50.
Second strategy
Detrended Synthetic Price is a function that is in phase with the
dominant cycle of real price data. This DSP is computed by subtracting
a half-cycle exponential moving average (EMA) from the quarter cycle
exponential moving average.
See "MESA and Trading Market Cycles" by John Ehlers pages 64 - 70.
WARNING:
- For purpose educate only
- This script to change bars colors.


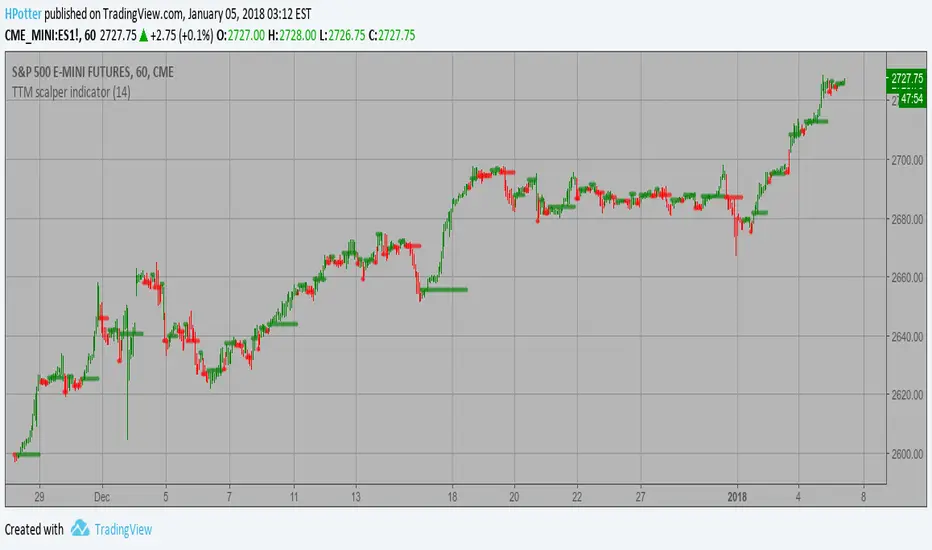
TTM scalper indicator Backtest TTM scalper indicator of John Carter’s Scalper Buys and Sells. The methodology
is a close approximation of the one described in his book Mastering the Trade.
The book is highly recommended. Note the squares are not real-time but will
show up once the third bar has confirmed a reversal.
You can change long to short in the Input Settings
WARNING:
- For purpose educate only
- This script to change bars colors.

TTM scalper indicator Strategy TTM scalper indicator of John Carter’s Scalper Buys and Sells. The methodology
is a close approximation of the one described in his book Mastering the Trade.
The book is highly recommended. Note the squares are not real-time but will
show up once the third bar has confirmed a reversal.
WARNING:
- This script to change bars colors.
Pivot Point Moving AveragesThis indicator contains two simple moving averages that is calculated from the pivot point rather than the closing price. This indicator is described in detail in chapter 6 of the book Candlestick and Pivot Point Trading Triggers: Setups for Stock, Forex, and Futures Markets by John L. Person.

UCS_TTM - Reversion BandsOk, Here we go - Version 1 of TTM Reversion Band goes live.
Link to TTM Reversion Band - www.tradethemarkets.com
Link to TTM Reversion Band Guide - kb.simplertrading.com
John Carters Mastering the trade - www.amazon.com
For the amount of information this has, the price tag is not hefty.
John's RTM Chapter Synopsis - www.tradethemarkets.com
What did I modify?
1. Automated the Daily + and Intraday settings. So Switching to intraday will change the setting automatically.
2. Added text callouts for RTM condition
a. John Carter's Indicator
b. Slope Based (my addition).
Future Improvement Planned.
1. Will Convert this into a system based on John's Indicator from TS.
2. Custom Options for Slope and MA setting for Trade filter.

UCS_TTM_Wave A & B & CThis is a replica of TTM Wave A B C.
The ABC Waves are comprised of various moving averages and oscillators (MACD) used to visualize the overall strength and direction of a given market across multiple time frames.
The “A Wave” measures short term relative strength and direction of a market, the “C Wave” measures longer term strength and the “B Wave” plots the same for a medium time period.
Here is the link to the ACTUAL Indicator - members.simpleroptions.com
Instruction -
Load the Indicator three times, Turn Off the Other two Waves. For eg., Wave A - Check / Wave B - Uncheck / Wave C - Uncheck. = This will plot Wave A.