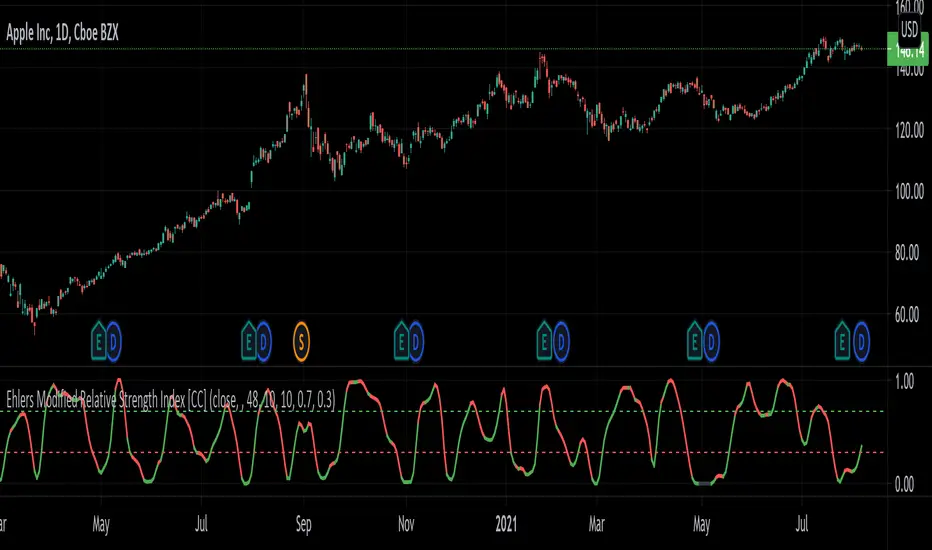
Ehlers Modified Relative Strength Index [CC]The Modified Relative Strength Index was created by John Ehlers (Cycle Analytics For Traders pgs 87-88) and this is a typical RSI that uses his roofing filter as the input. He smooths it with his own super smoother filter to provide signals. This indicator is extremely reactive and works in cycles so keep that in mind. I haven't been able to come up with clear buy and sell signals at this point so let me know if you any suggestions but I'm publishing the code to complete my goal of publishing all of his work one day. I will be publishing a bunch of Ehlers scripts in the next few weeks so stay tuned. What I recommend for buy and sell signals at this point are to buy when the indicator goes below the oversold line and starts going up and sell when the indicator goes below the oversold line a second time. Vice versa for sell signals.
Let me know if there are any other scripts you would like to see me publish!
John
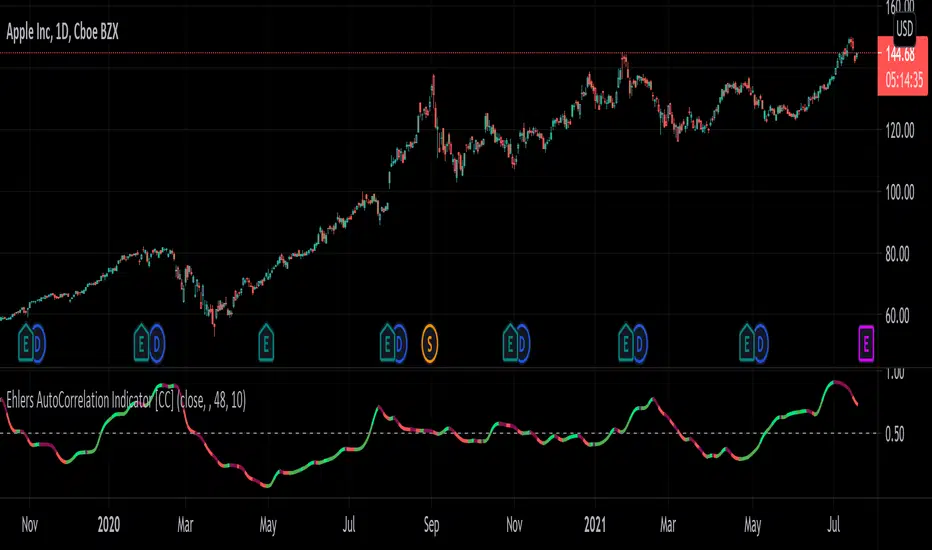
Ehlers AutoCorrelation Indicator [CC]The AutoCorrelation Indicator was created by John Ehlers (Cycle Analytics pgs 94-98) and this can be viewed as both a momentum indicator and a trend indicator. This was his basis for several other indicators that he created which I will be publishing soon but essentially as this indicator goes up then the stock is in an uptrend and also has upward momentum. You will notice that this indicator starts to go down even during an uptrend showing that the underlying trend is going to have an upcoming reversal. He also warns that the halfway mark is a possible reversal point so keep an eye out for that.
Generally speaking a good signal is to enter a long position when the indicator is under the midline and is starting to go up (or when the line is green) and to exit the position when the indicator goes over the midline. I have included strong buy and sell signals in addition to normal ones so darker colors mean strong signals and lighter colors mean normal signals.
Let me know if there are any other indicators you would like me to publish!
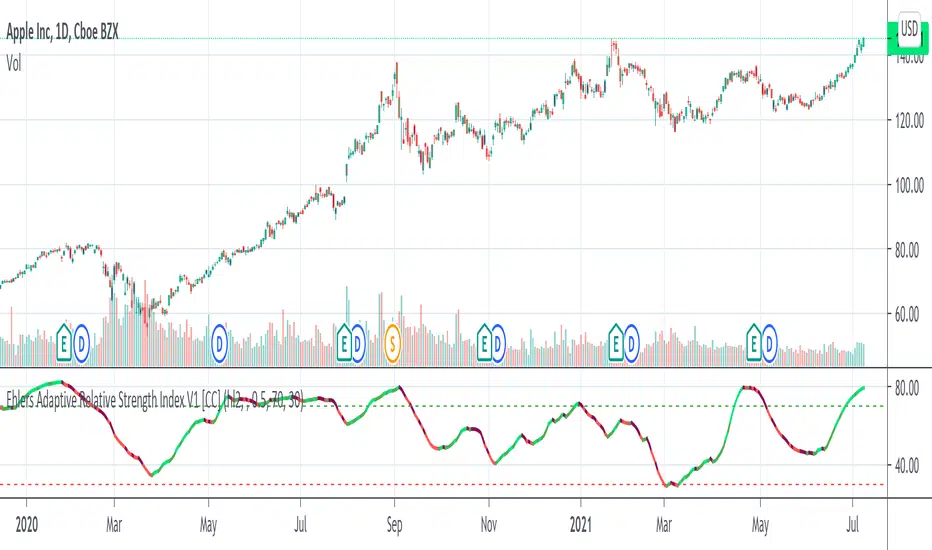
Ehlers Adaptive Relative Strength Index V1 [CC]The Adaptive Relative Strength Index was created by John Ehlers and this is his first version. I will of course publish his updated version at a later date along with publishing the final script from Jim Sloman's Ocean Theory book. I have changed his script to include extra smoothing to provide clear buy and sell signals. This is a version of a RSI that is very adaptive to changes by finding the length of the current cycle and using that to calculate the rsi and I use this same basic process to provide extra smoothing. A great strategy of course is to buy right after the indicator goes from below the oversold level to right above it and stay in until the indicator turns red or when it reaches the overbought level. I have included strong buy and sell signals in addition to normal ones and the darker colors mean strong signals and lighter colors are normal signals.
Let me know what other indicators you would like to see me publish!
Ehlers Distance Coefficient Filter [CC]The Distance Coefficient Filter was created by John Ehlers and this is one of his more unknown moving averages. It works well because in an uptrend or downtrend it behaves more like a trailing stop system but it also deals with issues like pullbacks pretty quickly. I think it works well with the default values but let me know if you find a more profitable system. Buy when the indicator turns green and sell when it turns red.
Let me know if there are any other indicators you would like to see me publish!

Ehlers Smoothed Adaptive Momentum [CC]The Smoothed Adaptive Momentum indicator was created by John Ehlers and this indicator gives a lot of useful information. When the indicator is above 0 then there is very strong upward momentum and when the indicator falls below 0 then there is very strong downward momentum. A very profitable way to use this particular indicator is buy long when the indicator is below 0 and it crosses over it's signal line and then sell of course when you get the first sell signal. I have included strong buy and sell signals in addition to normal ones so darker colors mean strong signals and lighter colors are normal signals. Buy when the line turns green and sell when it turns red.
Let me know if you have any other scripts you would like to see me publish!

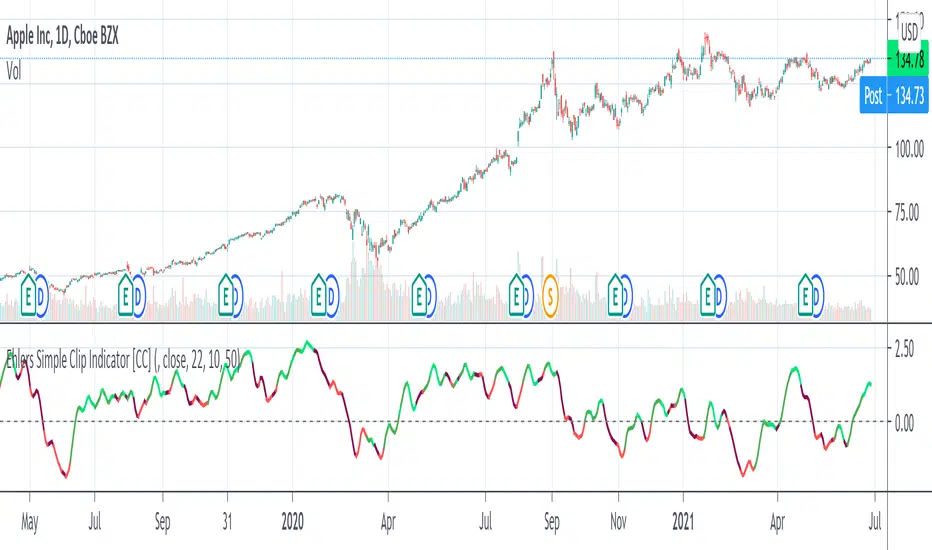
Ehlers Simple Clip Indicator [CC]The Simple Clip Indicator was created by John Ehlers (Stocks and Commodities June 2021 pg 10) and this is obviously very similar to the previous indicator I published ( Ehlers Simple Deriv Indicator ) so I would recommend to try both out and see what you prefer. This is a new momentum indicator that is extremely responsive to price changes and when the indicator is above 0 then this means the stock is in a long term uptrend and when it is below 0 then it is in a long term downtrend. I have color coded the indicator line to show you both strong buy and sell signals and normal buy and sell signals. Dark colors are strong signals and of course green means a buy signal and red means a sell signal. I did change the original buy and sell signals that Ehlers included in his scripts because I didn't find that they worked very well so let me know what you think of my changes.
Let me know if there are any other indicators you would like to see me publish!
Ehlers Adaptive Cyber Cycle [CC]The Adaptive Cyber Cycle was created by John Ehlers and this is a cycle based indicator which you don't find too many of these days. Each stock goes through cycles which are repeating patterns of price movement and cycle indicators help you find the timing of the cycle to capitalize on the underlying cycle. That is an extremely simple explanation but most importantly don't interpret these indicators as the same as other indicators because it may seem like there are very many false signals but that is because of the different cycles the stock is undergoing. Buy when the line turns green and sell when it turns red.
Let me know if there are any other indicators you would like to see me publish.

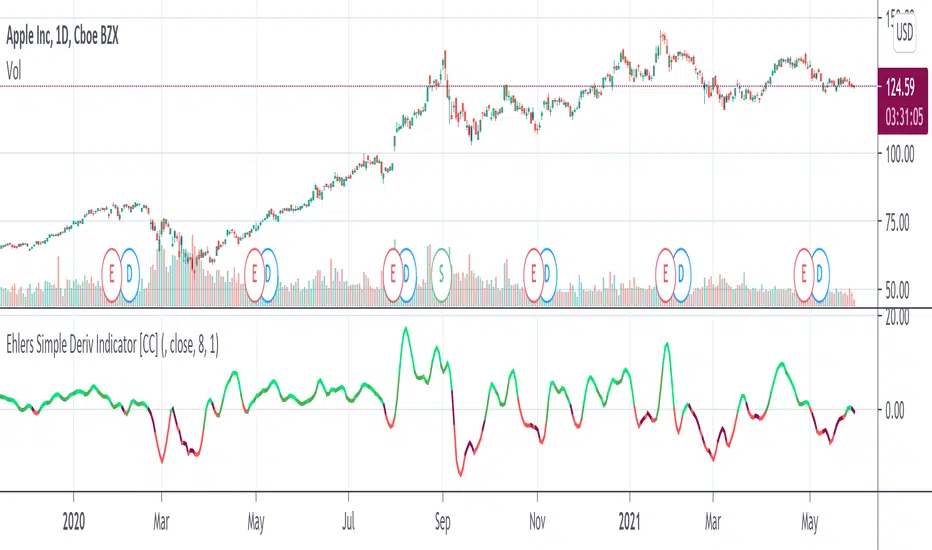
Ehlers Simple Deriv Indicator [CC]The Simple Deriv Indicator was created by John Ehlers (Stocks and Commodities June 2021 pg 10) and this is a heavily modified version of his original script that changes the buy and sell signals. I did testing with his original settings but they didn't seem to be very profitable for most stocks so I created my own system. This indicator does have a lag though so it is best used for trend confirmation imo. Buy when the line turns green and sell when it turns red.
Let me know if there are any other indicators you would like to see me publish!
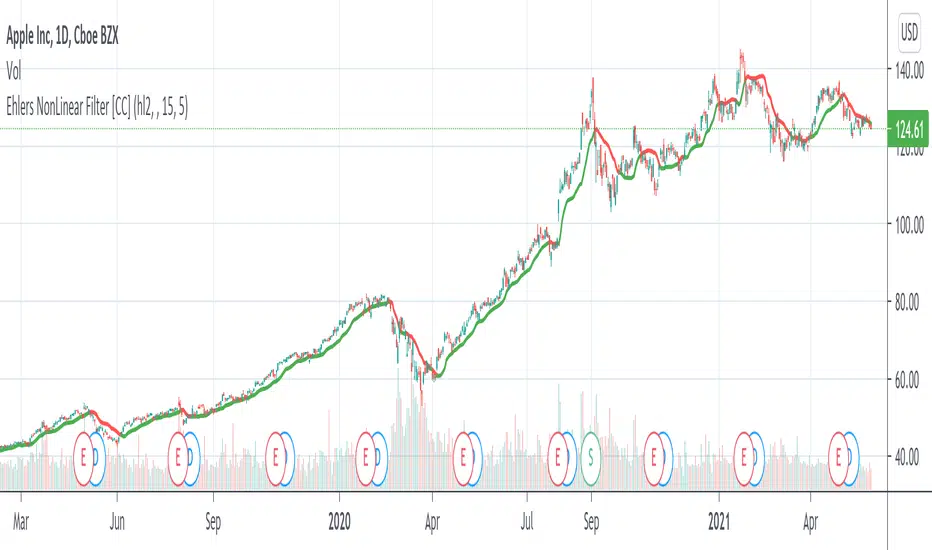
Ehlers NonLinear Filter [CC]The NonLinear Filter was created by John Ehlers and this one of his more unknown filters that work very well as a trendline and moving average. This is one of my favorites along with the instantenous trendlines that he created. Buy when the line turns green and sell when it turns red.
Let me know if there are any other indicators you would like to see me publish scripts for!
Ehlers 3 Pole Super Smoother Filter [CC]The 3 Pole Super Smoother Filter was created by John Ehlers and this is an oldie but a goodie. A great moving average that clearly shows a good trendline and so buy when the line turns green and sell when it turns red.
Let me know if there are any other indicators you want me to publish!

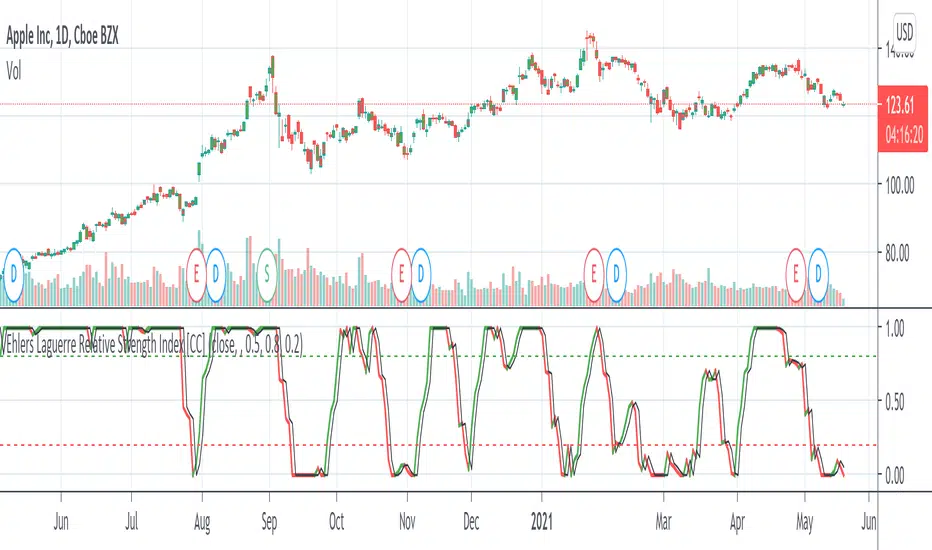
Ehlers Laguerre Relative Strength Index [CC]The Laguerre Relative Strength Index was created by John Ehlers and this is essentially his version of the RSI but I find that the buy and sell signals work better with his version as you can see. Buy when the line turns green and sell when the line turns red.
Let me know if there are any other indicators you want me to publish!
Ehlers Adaptive Center Of Gravity [CC]The Adaptive Center Of Gravity was created by John Ehlers and this is a regular center of gravity indicator combined to be use with the current cycle period. If you are not familiar with stock cycles then I would highly recommend his book on the subject: Cycle Analytics. Buy when the indicator turns green and sell when it turns red.
Let me know if there are any other indicators you want me to publish!

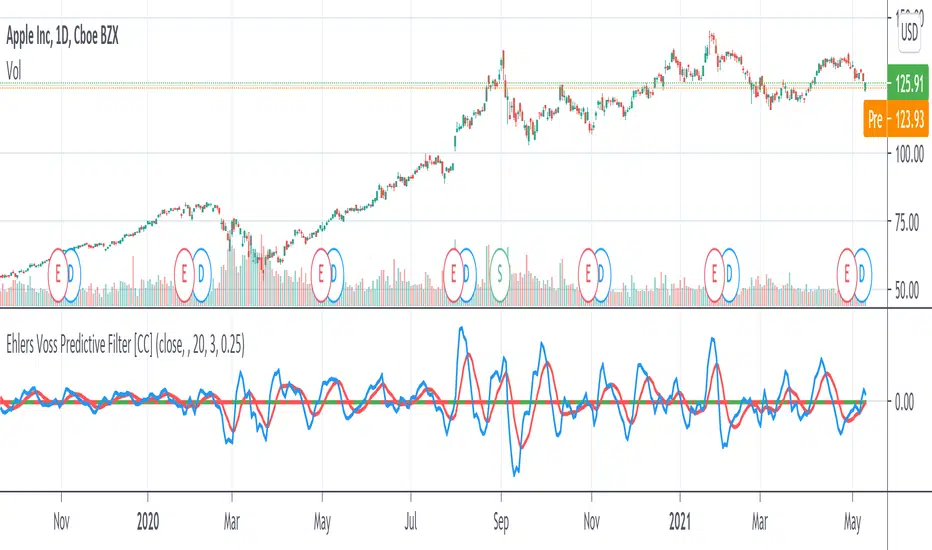
Ehlers Voss Predictive Filter [CC]The Voss Predictive Filter was created by John Ehlers (Stocks and Commodities August 2019) and this is a unique indicator in that it tries to predict future price action. I have color coded the middle line to show buy and sell signals so buy when the line turns green and sell when it turns red.
Let me know if there are any other indicators you want me to publish!
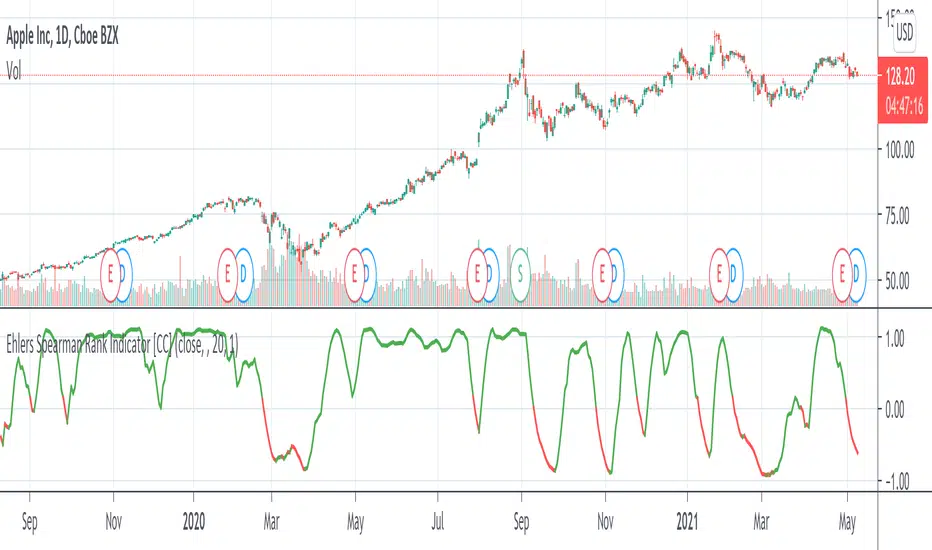
Ehlers Spearman Rank Indicator [CC]The Spearman Rank Indicator was created by John Ehlers (Stocks and Commodities July 2020 pg 6) and this works well as a trend confirmation indicator. This is obviously his take on the Spearman Ranking Correlation and make sure to let me know what you think! Buy when the line turns green and sell when it turns red.
Let me know if there are any other indicators you want me to publish!
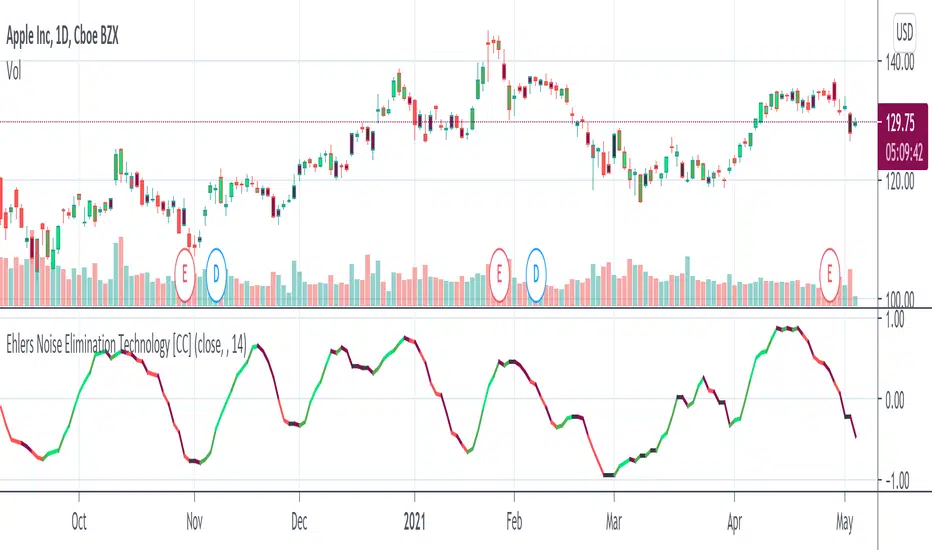
Ehlers Noise Elimination Technology [CC]The Noise Elimination Technology Indicator was created by John Ehlers (Stocks and Commodities Dec 2020 pg 17) and he created this indicator to be used with his version of RSI but I think it works well with any price data or any indicator really.
I'm trying a new signal system due to a request from @luckyCamel58789 so let me know what you think. I now differentiate between a buy and a strong buy when the indicator increases over itself twice and vice versa. Dark green is a strong buy and light green is a regular buy. Dark red is a strong sell and light red is a regular sell.
Let me know what indicators you would like to see me publish!
Ehlers FM Demodulator Indicator [CC]The FM Demodulator Indicator was created by John Ehlers (Stocks and Commodities May 2021 pg 14) and this indicator was created to accurately time any price variations which I think it does a great job. It is smoothed by default with his super smoother but feel free to substitute your own and try different combos. Buy when the line turns green and sell when it turns red.
Let me know if there are any other indicators you would like to see me publish!

Ehlers AM Detector [CC]The AM Detector was created by John Ehlers (Stocks and Commodities May 2021 pg 14) and this is his first volatility indicator I believe. Since this is a more informational indicator rather than a buy or sell signal generator, I have included buy and sell signals for a simple moving average but feel free to use this in combo with any other system you use. Buy when the line turns green and sell when it turns red.
Let me know if there are any other indicators you would like to see me publish!

Ehlers Adaptive Commodity Channel Index V1 [CC]The Adaptive Commodity Channel Index V1 was created by John Ehlers (Rocket Science For Traders pgs 236-237) and this is the typical Commodity Channel formula with the introduction of adaptive lengths based on his earlier work with indicators such as the Mother of Adaptive Moving Averages. For longer term signals you would get a bullish signal when CCI is above 0 and a bearish signal when CCI falls below 0. For shorter term signals you would get a bullish signal when crosses over it's overbought level or when it crosses above it's oversold level or vice versa. I have included both signals to make it easier.
Let me know if you want a custom script written or if you have a special request for me

Ehlers Adaptive Relative Vigor Index [CC]The Adaptive Relative Vigor Index was created by John Ehlers (Cybernetic Analysis For Stocks And Futures pgs 140-141) and it does a pretty good job of capturing the peaks and valleys of the underlying data. There are several ways to read this particular indicator so for long term trades then buy when it goes above 0 and sell when it falls below 0 or for shorter term trades then buy when the indicator line turns green and sell when it turns red.
Let me know if there are other indicators you would like to see me publish or if you want something custom done!

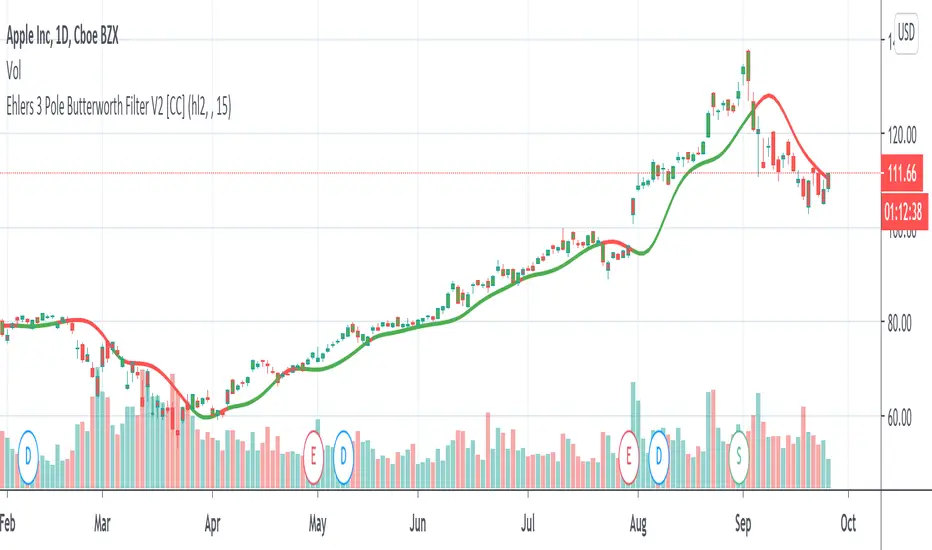
Ehlers 3 Pole Butterworth Filter V2 [CC]The 3 Pole Butterworth Filter was created by John Ehlers (Cybernetic Analysis For Stocks And Futures pgs 196-197) and this indicator is a moving average that also works well as a trendline. Buy when the indicator line turns green and sell when it turns red.
Let me know if you would like me to publish other indicators or if you want something custom done!
Ehlers Bandpass FilterThis script uses @cheatcountry script to determine Ehlers Bandpass Filter.
Backtest offers 3 capital management tools. One that will always calculate order size as initial capital/close, one that uses the same calculation but adds or substracts profit. The last one allows you to enter manually the size you want to trade.
The time-based stop will close the position after a set number of bars.

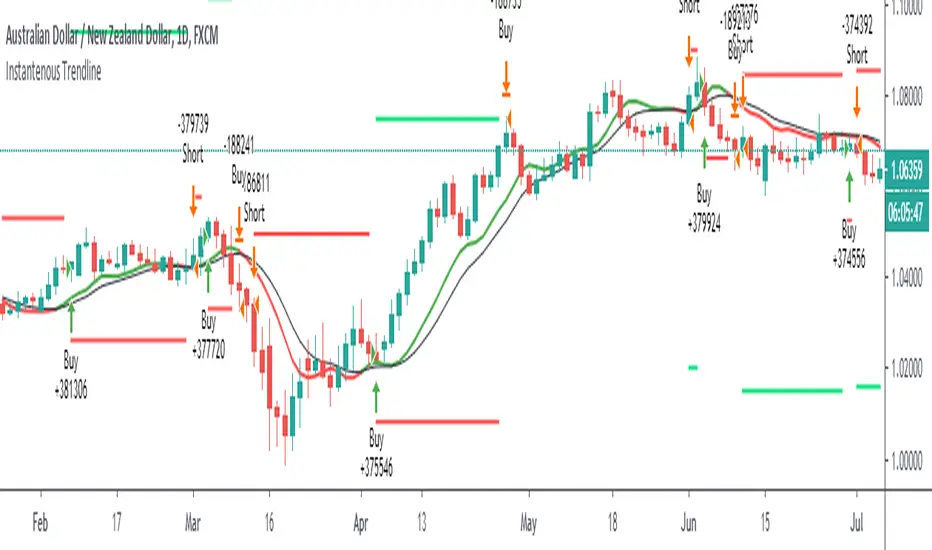
Etlers Instantenous TrendlineThis script uses @cheatcountry script to calculate Ehlers Instantenous Trendline .
Backtest offers 3 capital management tools. One that will always calculate order size as initial capital/close, one that uses the same calculation but adds or substracts profit. The last one allows you to enter manually the size you want to trade.
Green and red horizontal lines are profit/stop values.
Ehlers Instantaneous Trendline V2 [CC]The Instantaneous Trendline was created by John Ehlers (Cybernetic Analysis For Stocks And Futures pg 24) and this is an updated version of his original Instantaneous Trendline that works much better in my opinion. Buy when the indicator line turns green and sell when it turns red.
Let me know what other scripts you would like to see me publish or if you want something custom done!
