Ehlers 2 Pole Butterworth Filter V2 [CC]The 2 Pole Butterworth Filter was created by John Ehlers (Cycle Analytics For Traders pg 32) and this is an updated version of his original 2 pole Butterworth Filter script that seems to follow the price even closer. Buy when the indicator line turns green and sell when it turns red.
Let me know if there are other scripts you would like to see me publish or if you want something custom done!
John

Ehlers Cyber Cycle [CC]The Cyber Cycle was created by John Ehlers (Cybernetic Analysis For Stocks And Futures pg 34) and this is one of my favorite Ehlers indicators. I use it personally for exits but it has several uses. It gives great entry and exit signals when you enter when it is at the bottom or at the very top during a cycle. When it is above 0 then the stock is in a strong uptrend and when it is below 0 then the stock is in a strong downtrend. It is also very reactive as well with zero lag according to Ehlers. Buy when the indicator line is green and sell when it is red.
Let me know if there are other scripts you would like to see me publish or if you want something custom done!

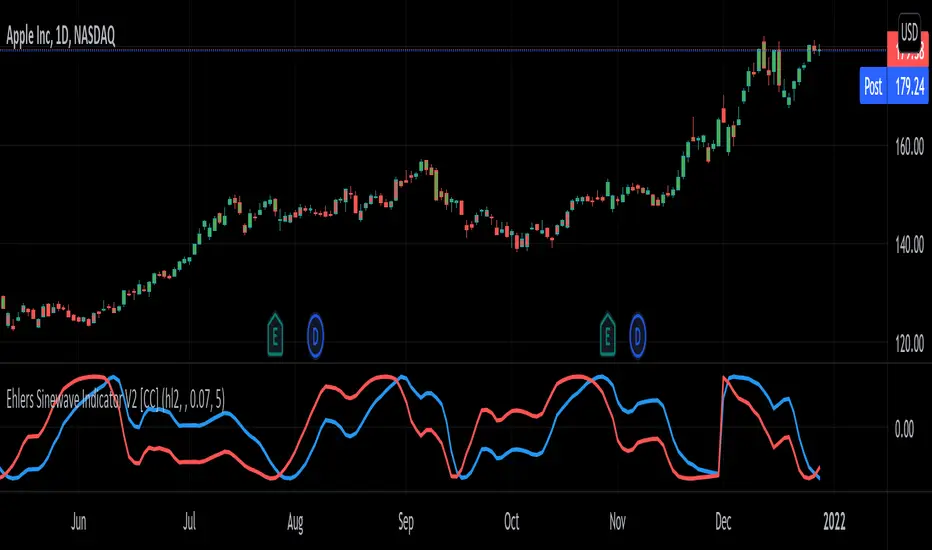
Ehlers Sinewave Indicator V2 [CC]The Sinewave Indicator was created by John Ehlers (Cybernetic Analysis For Stocks And Futures pgs 154-155) and this is an updated version of his original Sinewave Indicator which in my opinion seems to be more reactive to changes. Buy when the blue line crosses over the red line and sell when the blue line crosses under the red line. Also keep in mind that this indicator is based on cycles so it won't act the same as a typical indicator.
Let me know if there are other scripts you would like to see me publish or if you want something custom done!
Ehlers Hurst Coefficient [CC]The Hurst Coefficient was created by John Ehlers (Cycle Analytics For Traders pgs 67-68) and this is a very useful indicator to tell you if the stock is in a uptrend or downtrend. Feel free to change the length to experiment and to adjust to your needs. Buy when the indicator line is green and sell when it is red.
Let me know if there are other indicators you would like to see me publish or if you want something custom done!

Ehlers 2 Pole Butterworth Filter V1 [CC]The 2 Pole Butterworth Filter was created by John Ehlers (Cybernetic Analysis For Stocks And Futures pg 192) and this is one of his many filters that cuts out the noise and follows the price very closely. I recommend combining a 2 pole and 3 pole system of the same type of filter. Buy when the indicator line is green and sell when it is red.
Let me know if there are other indicators you would like to see or if you want something custom done!

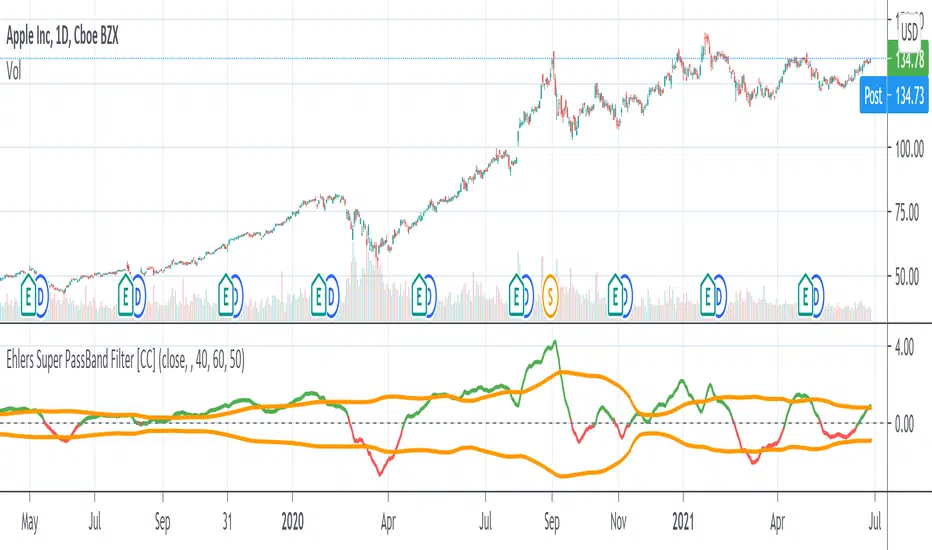
Ehlers Super PassBand Filter [CC]The Super PassBand Filter was created by John Ehlers (Stocks & Commodities V. 34:07 (10–13)) and this is a pretty useful indicator to let you know how volatile the market is right now. This is useful for scalpers because this lets you avoid the choppy markets (usually when the rms is 1.50 or less but feel free to choose your own level) and gives you good entry and exit points. Buy when the indicator line is green and sell when it is red.
Let me know if there are other indicators you would like to see me publish or if you want something custom done!
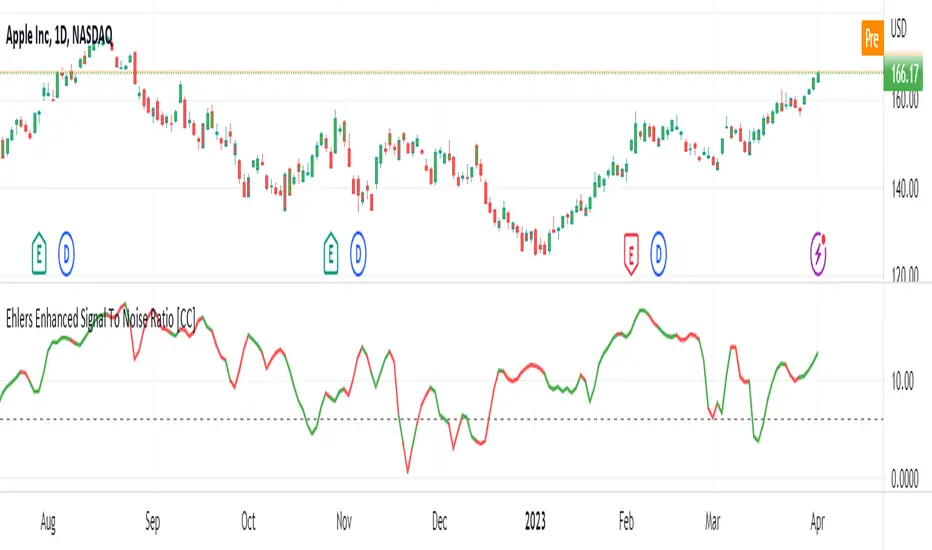
Ehlers Enhanced Signal To Noise Ratio [CC]The Enhanced Signal To Noise Ratio was created by John Ehlers (Rocket Science For Traders pgs 87-88) and this is my favorite Ehlers Signal To Noise Ratio indicator. Scalpers like to use this indicator because when it is above the dotted line then the stock is trending and not trading sideways. Buy when the indicator line is green and sell when it is red.
Let me know when you want to see me publish other indicators or if you want something custom done!
Ehlers Mother Of Adaptive Moving Averages [CC]The Mother Of Adaptive Moving Averages was created by John Ehlers (Rocket Science For Traders pgs 182-183) and this is definitely my favorite Ehlers moving average script. This works as a trend indicator and a typical moving average. When the mama is above the fama then the stock is in an uptrend and vice versa. Of course it is also good when the price is above the fama and mama lines. Buy when the indicator line is green and sell when it is red.
Let me know if there are other indicator scripts you would like to see me publish or if you want something custom done!

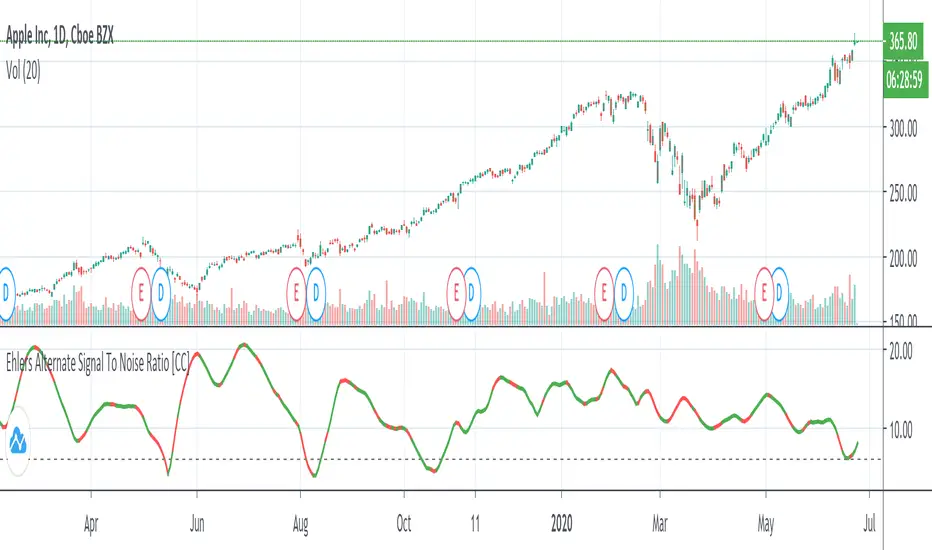
Ehlers Alternate Signal To Noise Ratio [CC]The Alternate Signal To Noise Ratio was created by John Ehlers (Rocket Science For Traders pgs 84-85) and this is a variation of his signal to noise ratio that some scalpers might find more useful than his default signal to noise ratio. You would want to buy and sell when the indicator is above the dotted line because that means the stock is volatile enough to maximize any movement of the trade in either direction. Buy when the indicator line is green and sell when it is red.
Let me know if there are other indicators you would like to see me publish or if you want something custom done!
Ehlers 2 Pole Super Smoother Filter V1 [CC]The 2 Pole Super Smoother Filter was created by John Ehlers (Cybernetic Analysis For Stocks And Futures pg 202) and this one of his filters that follows the price very closely. I would recommend to change the default settings to what fits your trading style the best. Buy when the indicator line turns green and sell when it turns red.
Let me know if there are other scripts you would like to see or if you want something custom done!

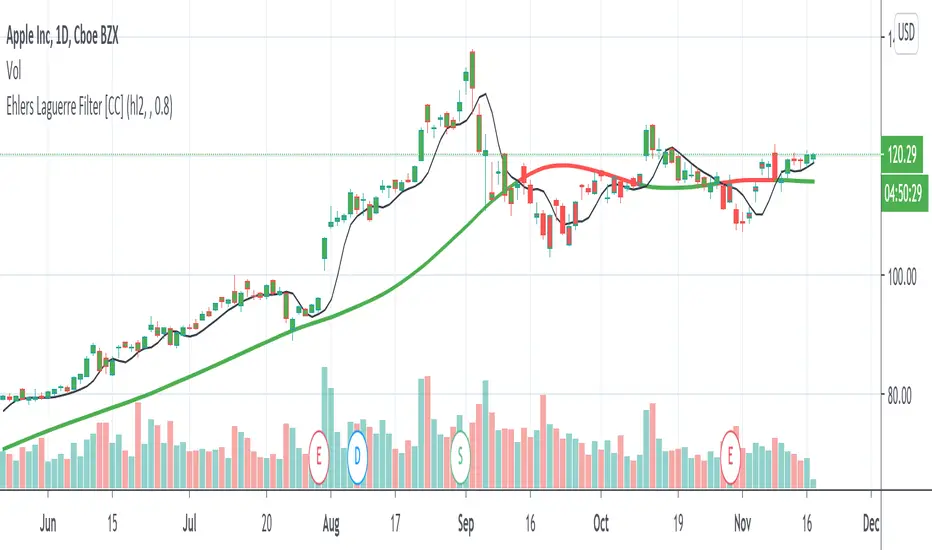
Ehlers Laguerre Filter [CC]The Laguerre Filter was created by John Ehlers (Cybernetic Analysis For Stocks And Futures pg 216) and this indicator works well with letting you know both the short and long term trend as well as a pretty good moving average. If the indicator line is above the black line then it is a long term uptrend and below the black line is a long term downtrend. Buy when the indicator line is green and sell when it turns red.
Let me know if there are other scripts you would like to see me publish or if you want something custom done!
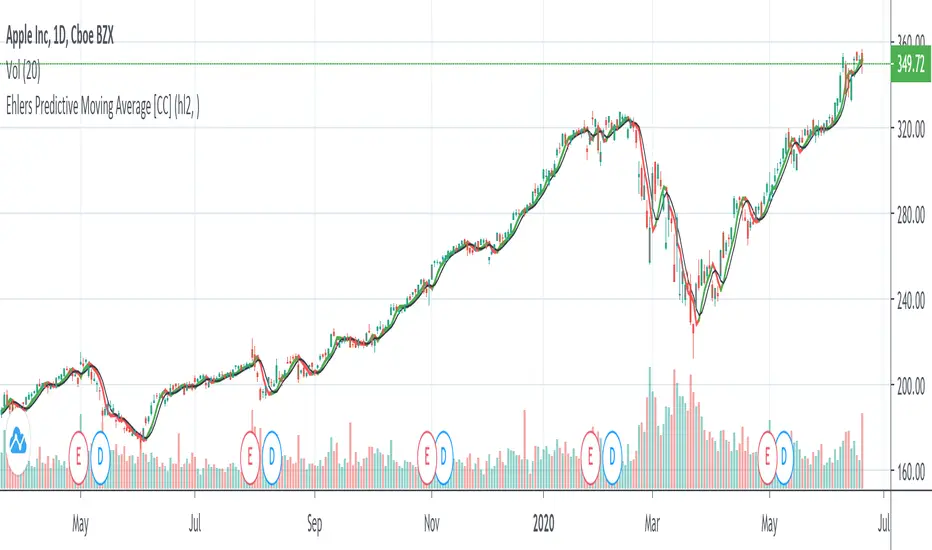
Ehlers Predictive Moving Average [CC]The Predictive Moving Average was created by John Ehlers (Rocket Science For Traders pg 212) and this is one of his first leading indicators. I have been asked by many people for more leading indicators so this one is for you all! Buy when the indicator line is green and sell when it is red.
Let me know if there are other indicators you would like to see me publish or if you want something custom done!
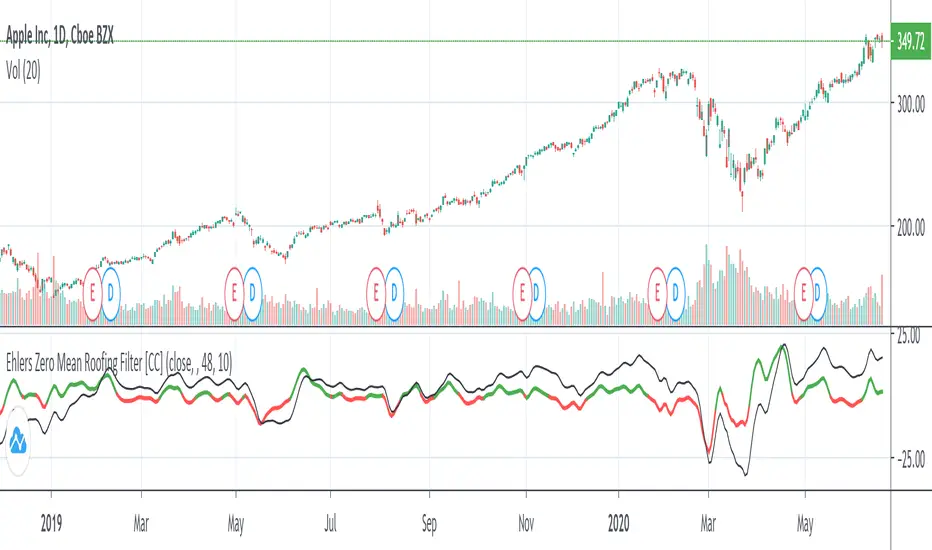
Ehlers Zero Mean Roofing Filter [CC]The Zero Mean Roofing Filter was created by John Ehlers (Cycle Analytics For Traders pg 80) and this is a much more reactive roofing filter compared to Ehler's Roofing Filter which I also added for reference. Buy when the indicator rises over 0 and sell when the indicator falls below 0.
This was a special request so let me know if there are other indicators you would like to see me publish or if you want something custom done!
Ehlers Roofing Filter [CC]The Roofing Filter was created by John Ehlers (Cycle Analytics For Traders pgs 81-82) and this can be interpreted in a few ways. When the indicator crosses over its signal then it is a short term uptrend and when it crosses below its signal then it is a short term downtrend. It is also in a major uptrend or downtrend when it is above 0 and below 0 respectively. Buy when the indicator line is green and sell when the indicator line turns red.
Let me know if there are other indicators you would like to see me publish or if you want something custom done!

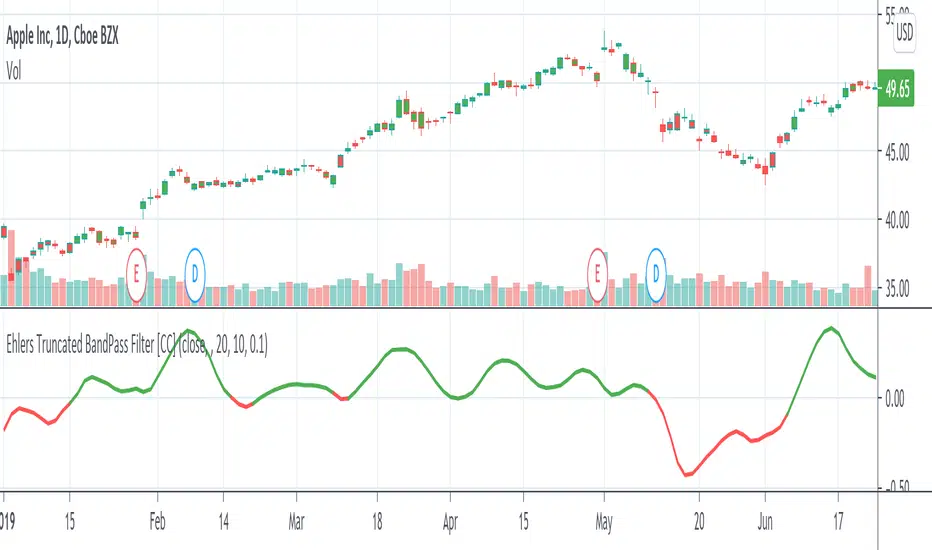
Ehlers Truncated BandPass Filter [CC]Hot off the presses! The Truncated BandPass Filter was created by John Ehlers (Stocks & Commodities July 2020) and this is a much more reactive version of his original bandpass filter. When the indicator rises above 0 then it is an uptrend and when it falls below 0 then it is in a downtrend. Buy when the indicator line is red and sell when it is green.
Let me know if there are other scripts you would like to see me publish or if you want something custom done!
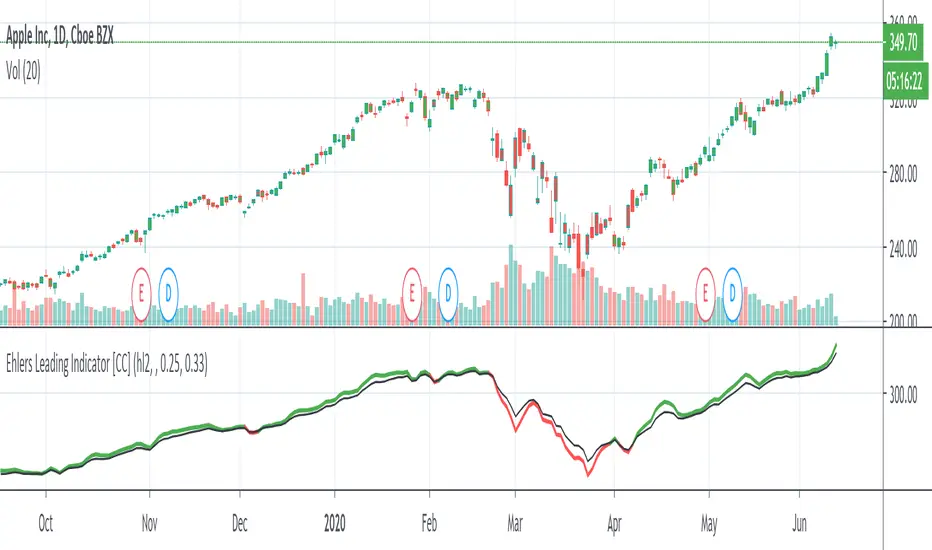
Ehlers Leading Indicator [CC]The Leading Indicator was created by John Ehlers (Cybernetic Analysis For Stocks And Futures pg 235) and as the name implies, this is a leading indicator that provides super early signals. Feel free to change the alpha values to adjust to your needs. Buy when the indicator line is green and sell when it is red.
Let me know if there are other scripts you would like to see me publish or if you want something custom done!
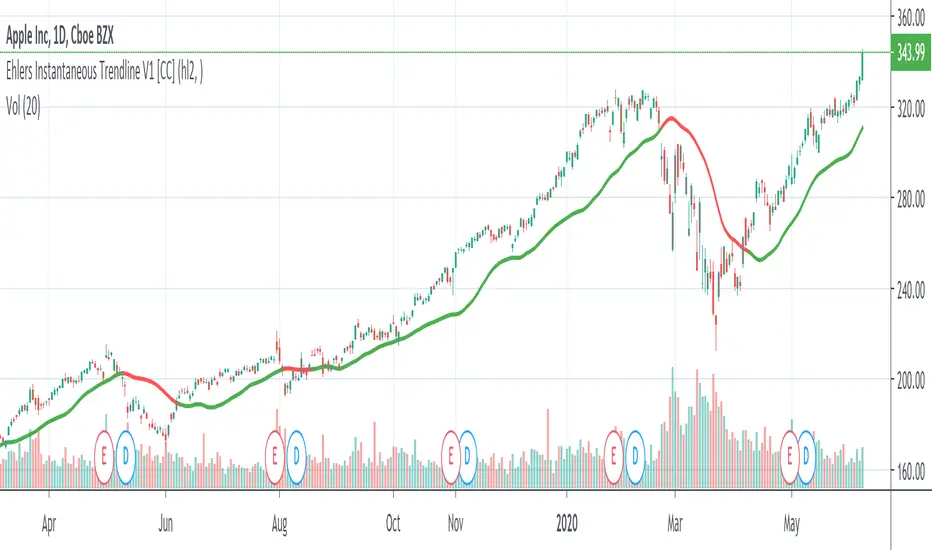
Ehlers Instantaneous Trendline V1 [CC]The Instantaneous Trendline was created by John Ehlers (Rocket Science For Traders pgs 109-110) and this indicator is perfect for determining the medium to long term trend. Buy when the indicator line is green and sell when it is red. I will be introducing a different version of this indicator which is perfect for short term trends so these will pair great together.
Let me know if there are other scripts you would like to see me publish or if you want something custom done!
Ehlers Decycler Oscillator [CC]The Decycler Oscillator was created by John Ehlers (Cycle Analytics For Traders pgs 43-44) and it is used to show transitions between uptrends and downtrends. If it rises above the 0 line then this means it has transitioned to an uptrend and it falls below the 0 line then it is in a downtrend. Buy if the indicator line is green and sell when it is red.
This was a custom request so let me know if you would like to see more scripts from me or if you want something custom done!

Ehlers Signal To Noise Ratio [CC]The Signal To Noise Ratio was created by John Ehlers (Rocket Science For Traders pgs 81-82) and this indicator is perfect for all of the scalpers out there! This will let you know when the stock is at a high volatility or not and when to buy or sell. If the indicator crosses over the dotted line then that means the stock is volatile and it is trading flat then it will be below the dotted line. Buy when the indicator line is green and sell when it is red.
This was a custom request so let me know if there are any other scripts you would like me to publish or if you want something custom done!

Ehlers Decycler [CC]The Decycler was created by John Ehlers (Cycle Analytics For Traders pgs 40-41) and this is a moving average that has an extremely low lag even though it uses a fairly high length to calculate everything. This can also work well as a trendline. Buy when the indicator line is green and sell when it is red.
Let me know if there are other scripts you would like to see me publish or if you want something custom done!

Ehlers HighPass-LowPass Roofing Filter [CC]The HighPass-LowPass Roofing Filter was created by John Ehlers (Cycle Analytics For Traders pg78) and this is a variation of a roofing filter that will let you know which direction the stock is trending. If it falls below 0 then the stock is in a downtrend and if it rises above 0 then it is an uptrend. Buy when the indicator line is green and sell when it is red.
Let me know if there are other scripts you would like me to publish or if you want something custom done!

Ehlers Hilbert Oscillator [CC]The Hilbert Oscillator was created by John Ehlers (Rocket Science For Traders pgs 90-91) and just like the sinewave indicator that I published yesterday, this is also a leading indicator. The big difference between this indicator and the sinewave is that this indicator works very well for determining major turning points in the stock before they happen. You will notice that when the blue line crosses over the red line that a few bars from that point, the stock will start an uptrend and the reverse is true. I have also included immediate buy and sell signals over the 0 line so buy when the line is green and sell when it is red
Let me know if you would like to see any other scripts from me or if you want something custom done!

Ehlers Sinewave Indicator [CC]The Sinewave Indicator was created by John Ehlers (Rocket Science For Traders pgs 97-99) and this is a few indicators in one. Simply put it is a leading indicator which you don't see too many of those these days. If the blue line crosses over the red line then within the next few bars the price will start an uptrend and if the blue line crosses below the red line then in the next few bars it will start a downtrend. I have also included an immediate buy and sell signal on the 0 line which is green when you should buy and red when you should sell.
Let me know if you would like to see any other scripts or if you want something custom done!
