Dow - Elliott - Murphy
Introduction
As I am going deeper into the subject of reading a chart, we definitely need to cover trends. As the saying goes: “the trend is your friend”. But where does it start and where does it end?
In the following article I’m going to cover basic principles in use for more than a century.
Furthermore, the Dow theory is still in use by prop trading companies, hedge funds and banks. And the reason is quite simple: trade what you see.
A. Charles Dow and the Dow theory
Not being the first nor the last, one of the most popular perspectives on markets and the basis of all technical analysis is reaching back to Charles Dow in the late 19th century. Dow set up some simple rules to analyze markets and to follow trends.
First and foremost, the overall market discounts everything, which means that all available information is to be found within price. Additionally, the market renews itself within cycles, which is also the reason why the indices are always in a long bias, because the weakest companies get replaced by new strong and upcoming businesses. The market is, like the capitalist economy in general, moving in progression and regression. While old ideas - and therefore businesses and their models - are fading out, new ideas entering the circle of evolution. (If you want to know more about the psychological background, from a sociological background, check Max Weber’s The Protestant Ethic and the Spirit of Capitalism at shorturl.at/vwA1, or Franz Boas’ The social organization and the secret societies of the Kwakiutl Indians regarding the need of the renewing of economic cycles from a cultural point of view at shorturl.at/uwD25).
Secondly, as stated, the market is built from two basic patterns - movement and correction. These patterns are expressed in a primary, secondary and tertiary trends, as plotted in the title image.
So we have to state that a trend is only existent if there is a move and a regression and a move exceeding the first top. Everything else remains interpretative!
Let’s have a quick look at a chart.

Above you’re seeing the BTCUSD from end 2019 ‘till mid 2020 on Bitfinance. In gray I’ve plotted moves that aren’t trends at all. I hereby repeat the obvious reason why:: a trend needs at least a higher high or a lower low from any starting point. But what’s within the plot above is just one high one low and something that might be called sideways.
The first time in this very long time period we’re having something that might be called a trend I’ve plotted in green, as you’re seeing below, even if it is not a “beauty”, neither close to perfect.
So let’s scale into the hourly and take a closer look.
I’ve set up the chart to close - which was one of Dow’s most sacred rules - and plotted the secondary downward trend in dotted red. This trend has shown signs to come to an end when a higher low has been made. But at this point the downward trend was still valid, even when the black line had been crossed. Why?
There are two rules for continuation and reversal:
In the case of a downtrend the latest high and the latest low are still valid, until they are confirmed by a new lower low OR the reversing trend has not only been broken (which is called a failure swing), but the new trend size is similar to the previous (non failure swing). The second case happened at point (3) and was confirmed at point (4) and (5) continuing higher (green dashed line).
I’ve also plotted a tertiary trend - red for down and green for up - in the following picture. This trend is also visible in the hourly chart and might be easier to visualize in the 10- or 15-minute chart. Also the fragility of the lower trend is visible. There are even more trends inside those three, but the smaller the trend the noisier the single moves and the more fractures are evident.
Overall, a trending push should be short in time, a regressive one long in time; a strong move might only be corrected by 33%, a mediocre one by 50% and a weak one by 66%, as a rule of thumb.
As another general rule, Charles Dow has been looking at different composite indices, and he discovered through close and steady observation, that one index ought to confirm the other; if not, there might be something “wrong” in the overall market conditions. The context of intermarket analysis was born.
B. Ralph N. Elliott and the Elliott Wave theory
Based on the Dow theory and the beautiful recurring cycles of growth in nature also known as Fibonacci numbers, Elliott came up with his theory of motive and corrective waves and their measurability, taking the Dow theory a step further and implementing a psychological approach. What does this mean?
Elliott supposed that - generally speaking - the beginning of a trend is not only marked by significant volume and rapid moves but also with heavy and steep corrections. And the reason is blatantly logical: As many traders are not yet convinced of a turn, they still sell or buy in direction of the previous one.Therefor, the so-called wave 1 is often corrected to a high degree or formed by widely overlapping price ranges (leading diagonal) as the overall market conditions are not clear yet. But when it is becoming obvious that the previous trend might have come to an end, new money is floating in and traders are jumping on board to profit from the new cycle. The hesitant and slow building up in volume and price movement is unleashing itself in an explosion. That’s why wave 3 and wave C are mostly longer than wave 1 and often indicated by unclosed gaps confirming trend strength as traders are jumping on the ongoing new trend.
As most traders are already positioned and new money doesn’t float in at the same pace, positions get slowly liquidated and the last traders, who are not positioned yet and are hoping for a late move and easy profits, are stepping in but fail to push strong enough. Consequently, wave 5 is usually shorter than wave 3, less impulsive, failing to make new highs or formed by overlapping prices (ending diagonal).
Again, we’re able to see this in any timeframe or any trend size, like on this 2 hour chart of USD/JPY below.
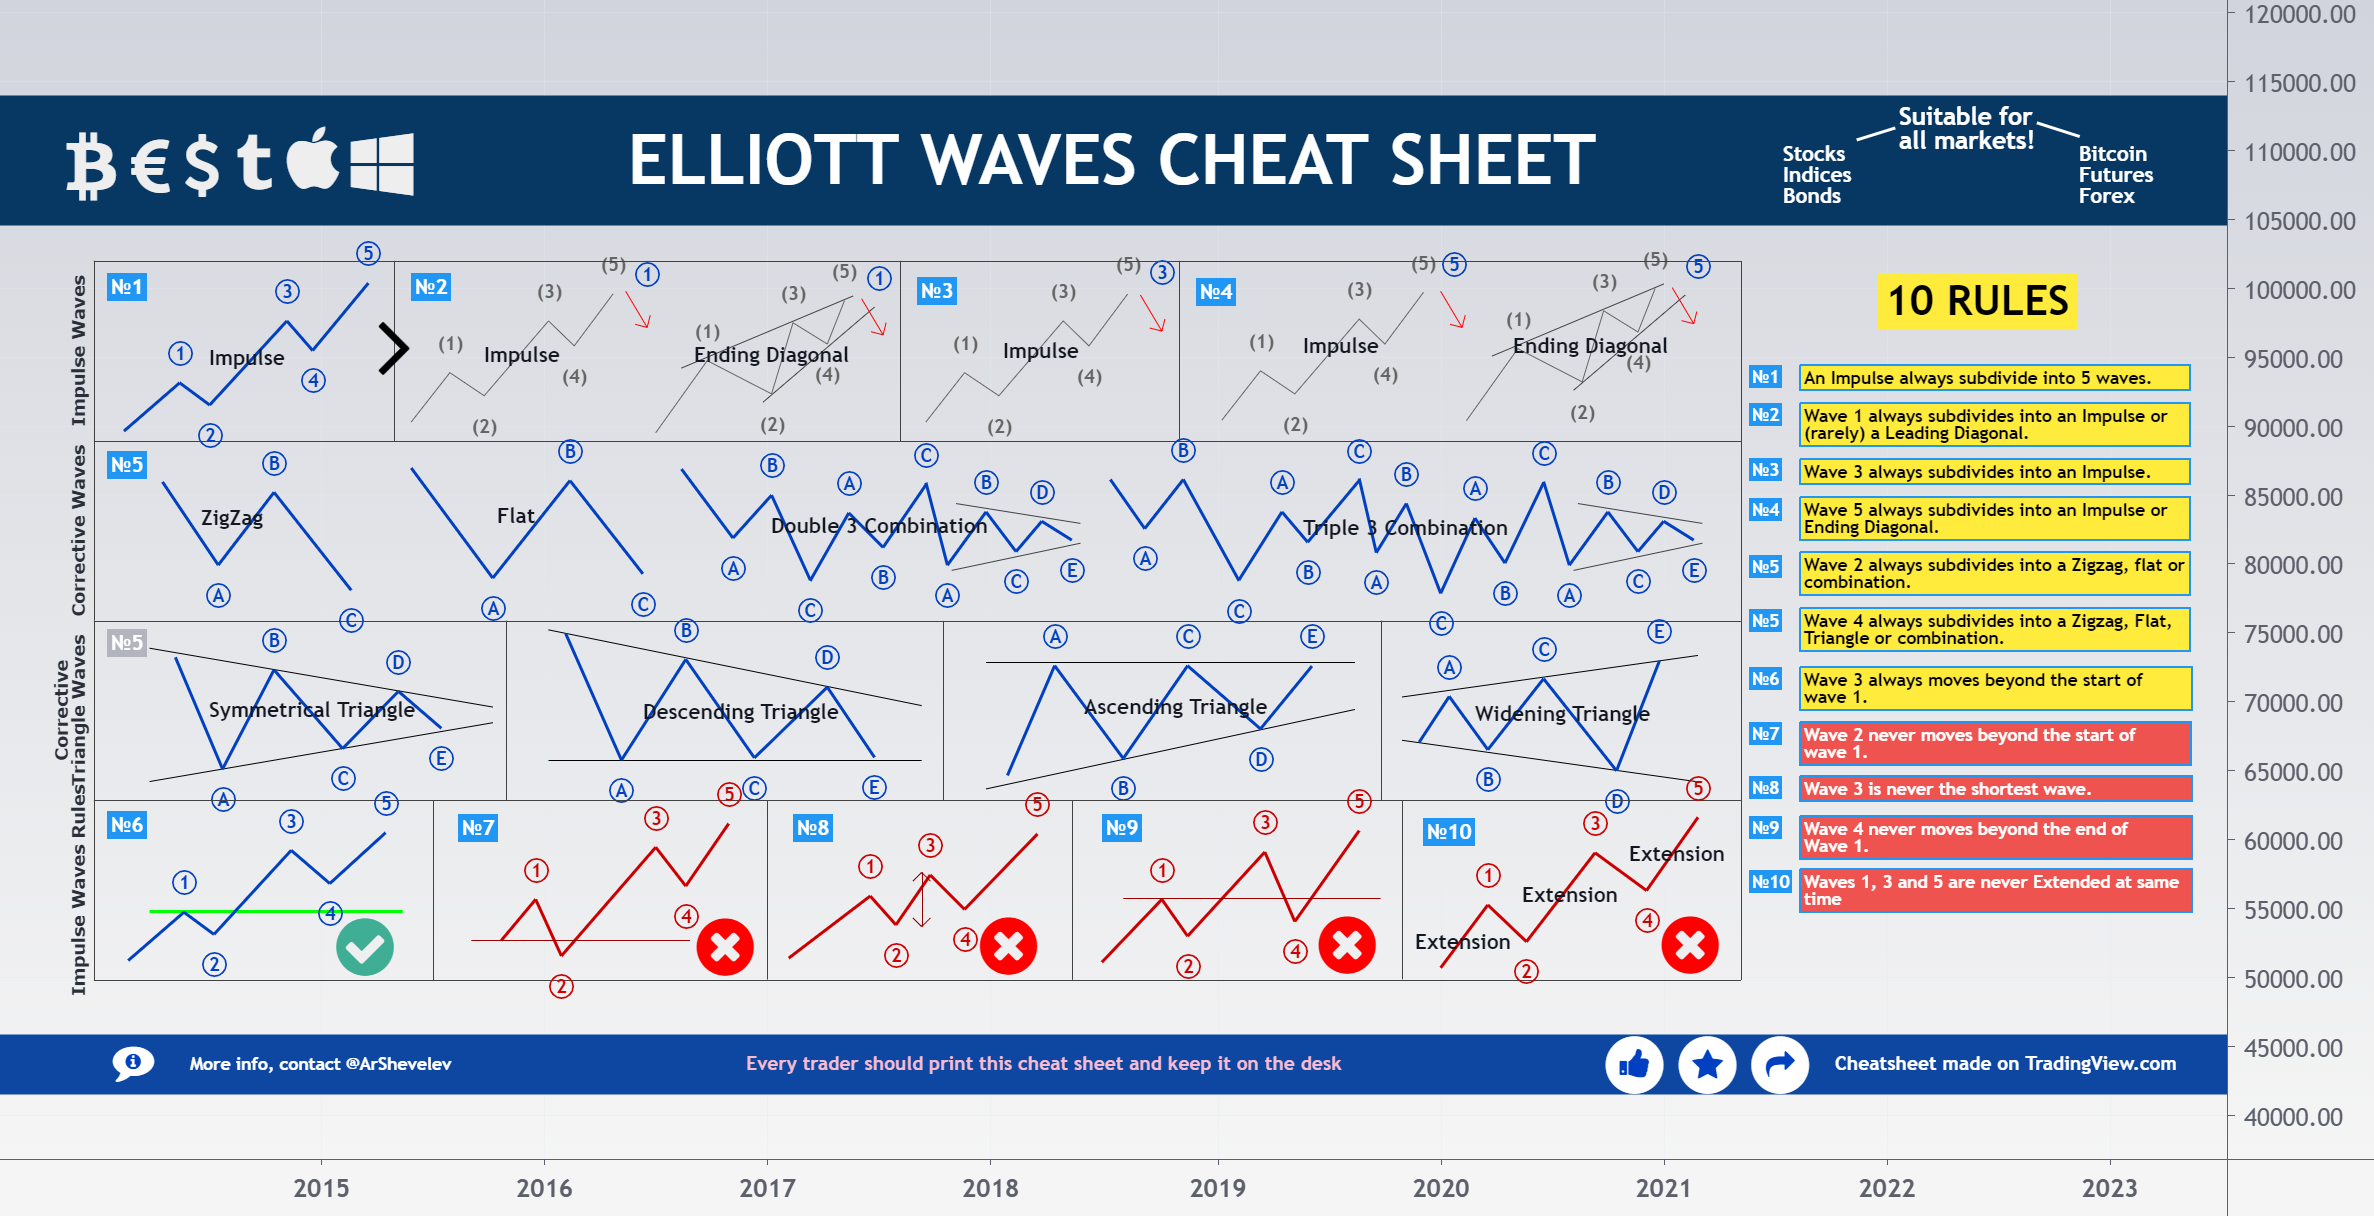
There are a bunch of rules, f.e. motive waves have to consist of 5 and corrective waves of 3 subsequent waves, but there are many, many more. Especially in Neo-Wave, the RSI is used to confirm the strength of a move. If you want to know more about this very specific subject, you may want to check out this very lovely made Elliott wave cheat sheet by @ArShevelev :
I’d like to add something that is ALWAYS missing in cheat sheets and overlooked by Elliott Wave analysts: The rules regarding price ranges are also to be taken into account for time ranges. The picture only unfolds itself if time and price and volume are analyzed to find opportunities, as Dow also took into account.
And even adding up to that, I’d like to quote an ingenious Elliott friend of mine: “If you are asking 10 different Elliott Wave specialists you’ll get at least 9 different analyses.”
And this is not the only obstacle in using Elliott Wave analysis.
C. John Murphy and technical analysis
As Elliott before him, Murphy added his very own personal perspective on the Dow theory. He expanded the approach of index confirmation to a whole intermarket analysis, using volume and plotting trend lines to indicate trend strength.
Exaggerated in the picture I’d just like to show - and here you should bear in mind that you can’t look into the future - that I don’t suggest trading trend lines. Which one would trade? Which one should you have taken? Are the other traders drawing the same trend lines or do they plot differently, maybe also due to different prices as in all markets usual, not only in ForEx, but especially in DEX, and also in stock markets, as I’ve covered in the previous chapter. Have you already been stopped out or are you still waiting for your entry for weeks, months or years?
As you may be successful trading trend lines, you still need to consider that those are very very subjective. You need to ask yourself this: Who is having the same analysis as I do? Maybe someone is looking at a different data feed as I’ve already mentioned, maybe someone else is looking at close only, maybe using Heiken Ashi, maybe, maybe, maybe. There are too many ifs and whens for my personal cup of trading.
If you like to get detailed information about Murphy’s approach, you can get his book here: amzn.to/2NFAIKE
At this point I wanted to quote something as “Trade what you see.” from Edwin Lefèvre’s tremendously entertaining book Reminiscence of a stock operator, but as I’ve started this article weeks ago, I forgot which phrase it was. Still you should read or listen to it (open.spotify.co...NE28MZccAYzqDkE?si=bHFD-A_...)
In either way, all technical analysis is based on the same principle: higher prices, higher highs, higher interest, higher volume or vice versa. Don’t overcomplicate it, whatever your strategy might be and don't forget to take time into account, to estimate the proper trend sizes.
___
Note:
As I’m writing a book about reading a chart,
I am going to post a couple of short articles on this topic and others related to it, e.g. trend, volume , Dow theory, auction theory and behaviorism.
If you are spotting some errors or if you like to add something, feel free to comment or pm.
Cheers,
Constantine -
p.s.: This article is not intended as any kind of trading advice.
Thanks to all for reading and I hope it will help you in your analysis and your trading career.
Thank you all for the interest in my book and to answer your questions: there is no release date yet as it is still a work in progress and it will be an educational novel.
Cheers,
Constantine -
Introduction
As I am going deeper into the subject of reading a chart, we definitely need to cover trends. As the saying goes: “the trend is your friend”. But where does it start and where does it end?
In the following article I’m going to cover basic principles in use for more than a century.
Furthermore, the Dow theory is still in use by prop trading companies, hedge funds and banks. And the reason is quite simple: trade what you see.
A. Charles Dow and the Dow theory
Not being the first nor the last, one of the most popular perspectives on markets and the basis of all technical analysis is reaching back to Charles Dow in the late 19th century. Dow set up some simple rules to analyze markets and to follow trends.
First and foremost, the overall market discounts everything, which means that all available information is to be found within price. Additionally, the market renews itself within cycles, which is also the reason why the indices are always in a long bias, because the weakest companies get replaced by new strong and upcoming businesses. The market is, like the capitalist economy in general, moving in progression and regression. While old ideas - and therefore businesses and their models - are fading out, new ideas entering the circle of evolution. (If you want to know more about the psychological background, from a sociological background, check Max Weber’s The Protestant Ethic and the Spirit of Capitalism at shorturl.at/vwA1, or Franz Boas’ The social organization and the secret societies of the Kwakiutl Indians regarding the need of the renewing of economic cycles from a cultural point of view at shorturl.at/uwD25).
Secondly, as stated, the market is built from two basic patterns - movement and correction. These patterns are expressed in a primary, secondary and tertiary trends, as plotted in the title image.
So we have to state that a trend is only existent if there is a move and a regression and a move exceeding the first top. Everything else remains interpretative!
Let’s have a quick look at a chart.
Above you’re seeing the BTCUSD from end 2019 ‘till mid 2020 on Bitfinance. In gray I’ve plotted moves that aren’t trends at all. I hereby repeat the obvious reason why:: a trend needs at least a higher high or a lower low from any starting point. But what’s within the plot above is just one high one low and something that might be called sideways.
The first time in this very long time period we’re having something that might be called a trend I’ve plotted in green, as you’re seeing below, even if it is not a “beauty”, neither close to perfect.
There are two rules for continuation and reversal:
In the case of a downtrend the latest high and the latest low are still valid, until they are confirmed by a new lower low OR the reversing trend has not only been broken (which is called a failure swing), but the new trend size is similar to the previous (non failure swing). The second case happened at point (3) and was confirmed at point (4) and (5) continuing higher (green dashed line).
I’ve also plotted a tertiary trend - red for down and green for up - in the following picture. This trend is also visible in the hourly chart and might be easier to visualize in the 10- or 15-minute chart. Also the fragility of the lower trend is visible. There are even more trends inside those three, but the smaller the trend the noisier the single moves and the more fractures are evident.
Overall, a trending push should be short in time, a regressive one long in time; a strong move might only be corrected by 33%, a mediocre one by 50% and a weak one by 66%, as a rule of thumb.
As another general rule, Charles Dow has been looking at different composite indices, and he discovered through close and steady observation, that one index ought to confirm the other; if not, there might be something “wrong” in the overall market conditions. The context of intermarket analysis was born.
B. Ralph N. Elliott and the Elliott Wave theory
Based on the Dow theory and the beautiful recurring cycles of growth in nature also known as Fibonacci numbers, Elliott came up with his theory of motive and corrective waves and their measurability, taking the Dow theory a step further and implementing a psychological approach. What does this mean?
Elliott supposed that - generally speaking - the beginning of a trend is not only marked by significant volume and rapid moves but also with heavy and steep corrections. And the reason is blatantly logical: As many traders are not yet convinced of a turn, they still sell or buy in direction of the previous one.Therefor, the so-called wave 1 is often corrected to a high degree or formed by widely overlapping price ranges (leading diagonal) as the overall market conditions are not clear yet. But when it is becoming obvious that the previous trend might have come to an end, new money is floating in and traders are jumping on board to profit from the new cycle. The hesitant and slow building up in volume and price movement is unleashing itself in an explosion. That’s why wave 3 and wave C are mostly longer than wave 1 and often indicated by unclosed gaps confirming trend strength as traders are jumping on the ongoing new trend.
As most traders are already positioned and new money doesn’t float in at the same pace, positions get slowly liquidated and the last traders, who are not positioned yet and are hoping for a late move and easy profits, are stepping in but fail to push strong enough. Consequently, wave 5 is usually shorter than wave 3, less impulsive, failing to make new highs or formed by overlapping prices (ending diagonal).
Again, we’re able to see this in any timeframe or any trend size, like on this 2 hour chart of USD/JPY below.
There are a bunch of rules, f.e. motive waves have to consist of 5 and corrective waves of 3 subsequent waves, but there are many, many more. Especially in Neo-Wave, the RSI is used to confirm the strength of a move. If you want to know more about this very specific subject, you may want to check out this very lovely made Elliott wave cheat sheet by @ArShevelev :
I’d like to add something that is ALWAYS missing in cheat sheets and overlooked by Elliott Wave analysts: The rules regarding price ranges are also to be taken into account for time ranges. The picture only unfolds itself if time and price and volume are analyzed to find opportunities, as Dow also took into account.
And even adding up to that, I’d like to quote an ingenious Elliott friend of mine: “If you are asking 10 different Elliott Wave specialists you’ll get at least 9 different analyses.”
And this is not the only obstacle in using Elliott Wave analysis.
C. John Murphy and technical analysis
As Elliott before him, Murphy added his very own personal perspective on the Dow theory. He expanded the approach of index confirmation to a whole intermarket analysis, using volume and plotting trend lines to indicate trend strength.
Exaggerated in the picture I’d just like to show - and here you should bear in mind that you can’t look into the future - that I don’t suggest trading trend lines. Which one would trade? Which one should you have taken? Are the other traders drawing the same trend lines or do they plot differently, maybe also due to different prices as in all markets usual, not only in ForEx, but especially in DEX, and also in stock markets, as I’ve covered in the previous chapter. Have you already been stopped out or are you still waiting for your entry for weeks, months or years?
As you may be successful trading trend lines, you still need to consider that those are very very subjective. You need to ask yourself this: Who is having the same analysis as I do? Maybe someone is looking at a different data feed as I’ve already mentioned, maybe someone else is looking at close only, maybe using Heiken Ashi, maybe, maybe, maybe. There are too many ifs and whens for my personal cup of trading.
If you like to get detailed information about Murphy’s approach, you can get his book here: amzn.to/2NFAIKE
At this point I wanted to quote something as “Trade what you see.” from Edwin Lefèvre’s tremendously entertaining book Reminiscence of a stock operator, but as I’ve started this article weeks ago, I forgot which phrase it was. Still you should read or listen to it (open.spotify.co...NE28MZccAYzqDkE?si=bHFD-A_...)
In either way, all technical analysis is based on the same principle: higher prices, higher highs, higher interest, higher volume or vice versa. Don’t overcomplicate it, whatever your strategy might be and don't forget to take time into account, to estimate the proper trend sizes.
___
Note:
As I’m writing a book about reading a chart,
I am going to post a couple of short articles on this topic and others related to it, e.g. trend, volume , Dow theory, auction theory and behaviorism.
If you are spotting some errors or if you like to add something, feel free to comment or pm.
Cheers,
Constantine -
p.s.: This article is not intended as any kind of trading advice.
Thanks to all for reading and I hope it will help you in your analysis and your trading career.
Thank you all for the interest in my book and to answer your questions: there is no release date yet as it is still a work in progress and it will be an educational novel.
Cheers,
Constantine -