📌 Recent Price & Context
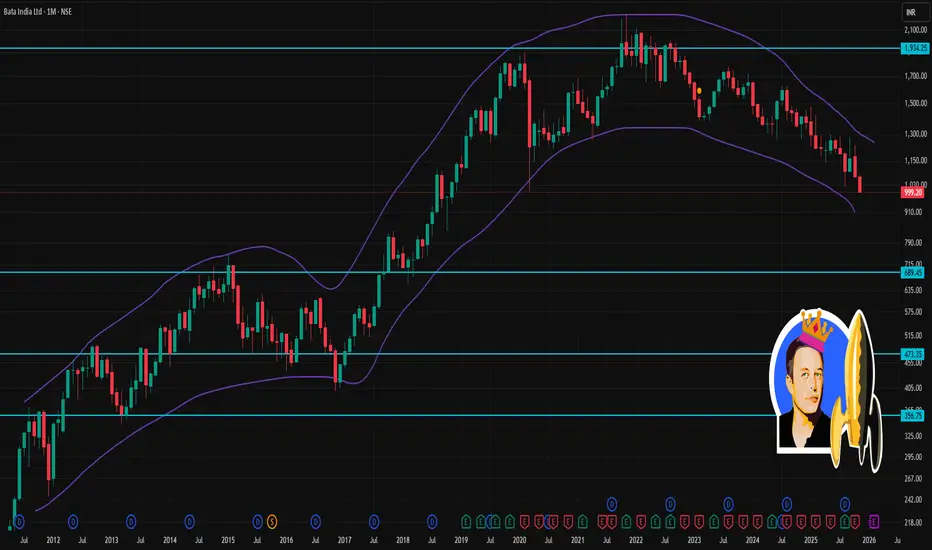
The stock has recently traded around ₹1,000–₹1,010 levels.
The 52-week high is ~₹1,479; 52-week low is ~₹996–₹1,005 (depending on the source) — so recent levels are close to the lower end of the 52-week range.
The stock has been under pressure lately, partly due to weak Q2 FY26 results which dragged sentiment.
⚠️ Key Risks & What’s Dragging the Stock
Weak recent financial performance — recent quarter’s poor results have weighed on sentiment.
Technical picture remains weak: price below all major moving averages, multiple sell signals on daily charts.
High volatility and lack of clarity on demand — any bounce may be shallow unless firm positive triggers come (e.g. good sales data, broader market up-move, sector tailwinds).
関連の投稿
免責事項
この情報および投稿は、TradingViewが提供または推奨する金融、投資、トレード、その他のアドバイスや推奨を意図するものではなく、それらを構成するものでもありません。詳細は利用規約をご覧ください。
関連の投稿
免責事項
この情報および投稿は、TradingViewが提供または推奨する金融、投資、トレード、その他のアドバイスや推奨を意図するものではなく、それらを構成するものでもありません。詳細は利用規約をご覧ください。