Hello
It's a Bitcoin Guide.
If you "follow"
You can receive real-time movement paths and comment notifications on major sections.
If my analysis was helpful,
Please click the booster button at the bottom.

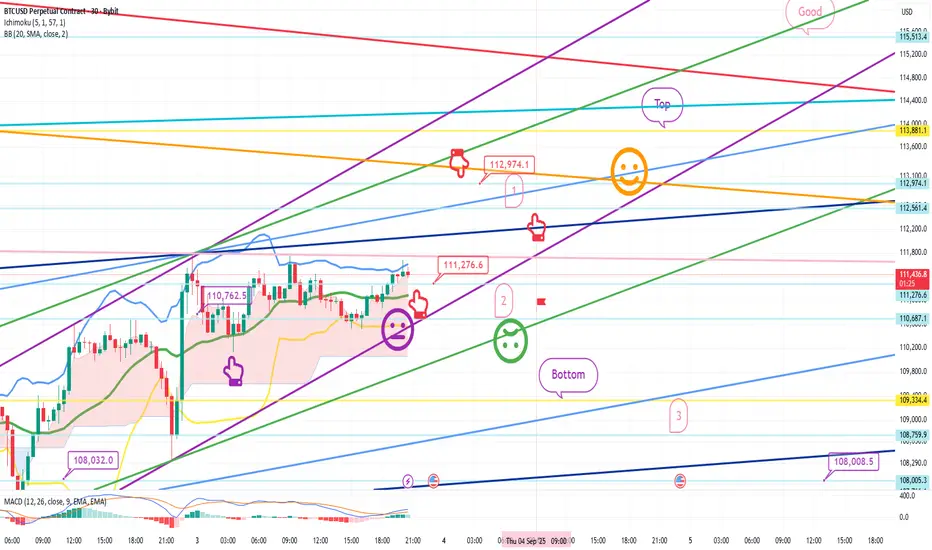
This is a Bitcoin 30-minute chart.
The Nasdaq indicators will be released at 11:00 AM.
At the bottom left is the long position entry point from the 1st, $108.032.
Above that is the purple finger at $110,762.5.
I've linked the strategy to the long position re-entry point.
*If the red finger follows the path,
it's a one-way long position strategy.
1. Long position entry point at $111,276.6 / Stop loss if the green support line is broken.
If the price falls sharply from the current level,
it's a long position waiting point up to section 2.
If the price touches or breaks the green support line,
it breaks the short-term pattern, which is not a good strategy for long positions.
2. Long position at $112,974.1, first target -> top section, second target
When it reaches 112.9K, the first section is the upper section for re-entry into a long position.
The uptrend line is the green support line -> the deep blue support line.
From the second section, it could fall to the bottom -> the third section -> 108K.
From the deep blue support line,
a medium- to long-term correction and sideways trading may follow, so please keep this in mind.
As long as the Nasdaq doesn't crash today, that's fine.
Please use my analysis as a reference only.
I hope you operate safely, with a strict trading strategy and stop-loss orders.
Thank you.
It's a Bitcoin Guide.
If you "follow"
You can receive real-time movement paths and comment notifications on major sections.
If my analysis was helpful,
Please click the booster button at the bottom.
This is a Bitcoin 30-minute chart.
The Nasdaq indicators will be released at 11:00 AM.
At the bottom left is the long position entry point from the 1st, $108.032.
Above that is the purple finger at $110,762.5.
I've linked the strategy to the long position re-entry point.
*If the red finger follows the path,
it's a one-way long position strategy.
1. Long position entry point at $111,276.6 / Stop loss if the green support line is broken.
If the price falls sharply from the current level,
it's a long position waiting point up to section 2.
If the price touches or breaks the green support line,
it breaks the short-term pattern, which is not a good strategy for long positions.
2. Long position at $112,974.1, first target -> top section, second target
When it reaches 112.9K, the first section is the upper section for re-entry into a long position.
The uptrend line is the green support line -> the deep blue support line.
From the second section, it could fall to the bottom -> the third section -> 108K.
From the deep blue support line,
a medium- to long-term correction and sideways trading may follow, so please keep this in mind.
As long as the Nasdaq doesn't crash today, that's fine.
Please use my analysis as a reference only.
I hope you operate safely, with a strict trading strategy and stop-loss orders.
Thank you.
手動でトレードを終了しました
Hello,It's a Bitcoin Guide.
I'll check the movement since writing the analysis on September 3rd.
This is a 30-minute chart for the Nasdaq.
Key areas are marked with black fingers.
In the red finger long position strategy,
after a gap reversal at the top,
it failed to touch the purple finger's first area,
and after entering a long position at 23,333.4 points at the bottom, it ended in a sideways movement.
On September 4th, and until this morning, it rebounded strongly,
and is now rising from the top target price to good.
Great is just around the corner.
The Nasdaq strategy is perfect.
This is a 30-minute chart for Bitcoin.
Key areas are marked with black fingers.
With the purple finger on the left,
after entering a long position at $110,7623.5 on September 2nd,
I connected it with the long position strategy shown by the red finger.
After entering a long position at $111,276.6,
it closed after touching the first section (112.5K) at the top.
It lacked some strength until reaching the target price of 112.9K.
The strategy involved manual liquidation.
After the blind decline on September 4th,
it touched the bottom section I indicated,
and reached the target price of $112.974.1.
It could have been a third consecutive move, but lately, it's been a real shame it wasn't perfect.
The current position has reached the center line of the daily Bollinger Bands,
and it will be crucial to see how it plays out.
I hope everyone practices safe trading and operates according to principles.
Thank you.
ノート
Hello,It's a Bitcoin Guide.
I'll check the movement after writing the analysis on September 5th.
This is a 30-minute chart of the Nasdaq.
I didn't post a separate analysis,
but the red finger long position strategy was used.
There was a rebound at the 9:30 AM data release,
but a sharp decline occurred as the US market opened at 10:30 AM.
After breaking out of the 23.7K long position entry point,
it fell to the green support line below the bottom.
This is a 30-minute chart of Bitcoin.
Key areas are marked with black fingers.
Failing to break through the first section at the top, it linked directly with the Nasdaq, and then fell to the second section at the bottom, after breaking out of the 111.8K long position entry point.
The first section has become the best short position entry point.
Strategy: Cut your losses.
The gap at the top that occurred over the weekend,
reversed after this week's weekly and daily candlesticks were created,
and the rebound continues.
I'll explain the details in the analysis article.
Thank you.
ノート
Hello,It's a Bitcoin Guide.
I'll check the movement after writing the analysis on September 8th.
This is a 30-minute chart of the Nasdaq.
Key areas are marked with black fingers.
In the red finger long position strategy,
the price ended in extreme sideways movement, from the first short at 23.836 to the second long at 23.727.7.
This is a 30-minute chart of Bitcoin.
Key areas are marked with black fingers.
In the red finger long position strategy,
the price failed to touch the long position entry level at $111,628.1,
and closed with a slight rebound.
After a new daily candlestick was created,
it touched the bottom at $111,061.7,
and reached the target price of $113,043.9 at the top.
Since the entry point failed and the price bypassed the bottom,
the strategy was canceled.
If this had been a normal wave,
a perfect long entry would have occurred.
But after touching the bottom, the green support line was damaged, and the perfect position was reached.
In any case,
this rebound continued after touching the daily support + weekly centerline pattern.
Depending on the Nasdaq movement,
it appears the correct direction will be revealed soon.
Thank you.
ノート
Hello,It's a Bitcoin Guide.
I'll check the movement after writing the analysis on September 9th.
This is the Nasdaq 30-minute chart.
Key sectors are marked with black fingers.
The light blue fingers indicate a short-to-long or long-hold strategy at point 1.
It broke through the purple support line first,
touched point 23.7K at point 1, and then rebounded to close.
As I explained yesterday, the 4-hour MACD dead cross occurred,
but after a successful rebound from point 1+4 (point 1),
the dead cross signal was ignored.
The strategy is working perfectly.
This is the Bitcoin 30-minute chart.
Key sectors are marked with black fingers.
In the lower left corner, the purple finger indicates
the bottom of September 8th at $110,061.7.
After a strong rebound to the orange resistance line,
the red finger indicates a waiting strategy for a long position.
If the first section at the top held, a vertical rise was expected,
but the pink resistance line failed to break through, creating the best short entry point.
After entering a long position at $111,917.1, the green support line was broken.
The bottom, indicated below, fell to section 2, and a rebound is underway.
The strategy was cut.
The strategy worked perfectly on the Nasdaq,
and on Bitcoin, I competed on timing and pattern at 111.9K, but unfortunately, it fell further.
Those who utilized the real-time 5-minute trend reversal at the entry point
would have found it easy to enter a long position at section 2.
Currently, after touching the second zone, the price is rebounding to around $1,300.
I hope you're managing your long and short positions well.
Thank you.
*비트코인가이드 공식텔레그램 Telegram
t.me/BTG_Group
*빙엑스 BingX 50%DC+$5,000 (총1회수수료)
bingx.com/invite/YBM3A4
*바이비트 Bybit 20%DC+$5,020
partner.bybit.com/b/Bitcoin_Guide
*앞으로는 하단의 네이버카페에서만 활동합니다.
cafe.naver.com/loanlife82
t.me/BTG_Group
*빙엑스 BingX 50%DC+$5,000 (총1회수수료)
bingx.com/invite/YBM3A4
*바이비트 Bybit 20%DC+$5,020
partner.bybit.com/b/Bitcoin_Guide
*앞으로는 하단의 네이버카페에서만 활동합니다.
cafe.naver.com/loanlife82
関連の投稿
免責事項
この情報および投稿は、TradingViewが提供または推奨する金融、投資、トレード、その他のアドバイスや推奨を意図するものではなく、それらを構成するものでもありません。詳細は利用規約をご覧ください。