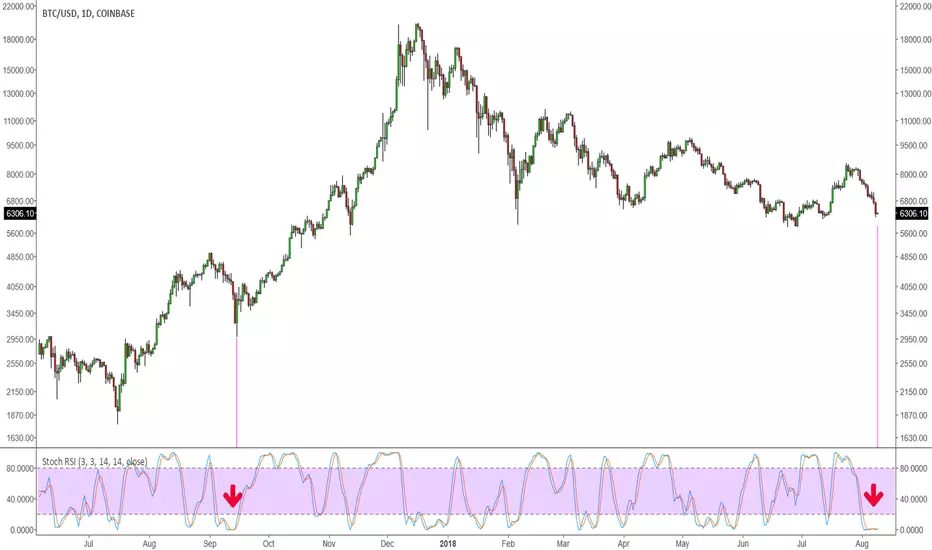
I made a peculiar observation while looking at the charts this evening. Everybody looks at the price for waves, support / resistance, fibs, etc. etc. etc. But while looking at the daily Stochastic RSI Indicator I noticed that it has basically flat-lined. That seemed odd so I went back as far as I could to find something similar. I could only find one similar occurrence. This is the chart. Make of it what you will.
Disclaimer. I've been long since about $6,185, so yeah, I'm looking for this bounce to continue. :)
Disclaimer. I've been long since about $6,185, so yeah, I'm looking for this bounce to continue. :)
ノート
A closer look at the current flat-line. Some body get the paddles and jump this patient!ノート
I just magnified the flat line to get a little more detail on what is going on here. It looks like it finally crossed. It will be interesting to see what follows....手動でトレードを終了しました
I took a small profit and closed my long. Currently flat. I'm not happy with the price reaction so. Could it go higher? Sure. Could it flush even further? Yep. For that reason I'm going to sit back and wait for a better long entry. I'm not 100% convinced the decline is over and I have no clue if, or how large/small, any retrace might be. I have an idea, but not many ideas are working 100% lately so nothing is reliable.免責事項
これらの情報および投稿は、TradingViewが提供または保証する金融、投資、取引、またはその他の種類のアドバイスや推奨を意図したものではなく、またそのようなものでもありません。詳しくは利用規約をご覧ください。
免責事項
これらの情報および投稿は、TradingViewが提供または保証する金融、投資、取引、またはその他の種類のアドバイスや推奨を意図したものではなく、またそのようなものでもありません。詳しくは利用規約をご覧ください。