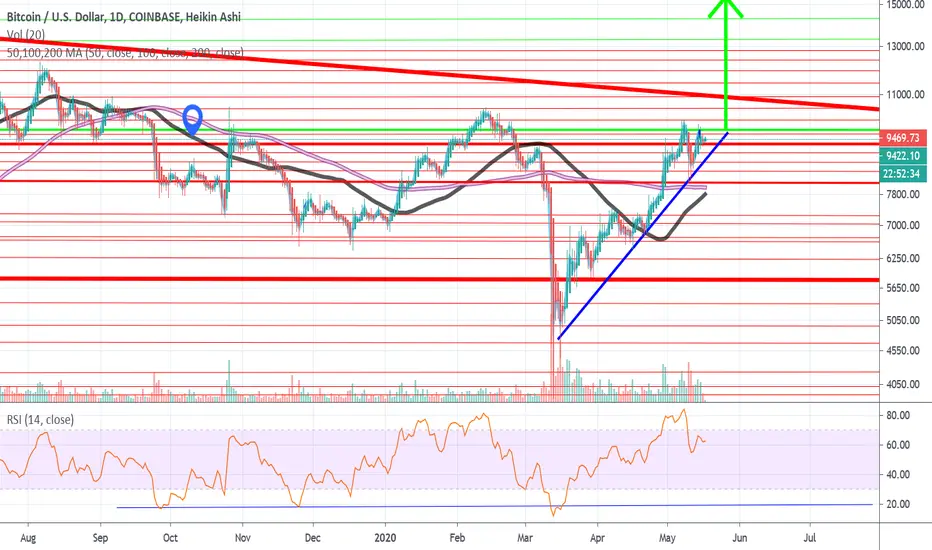
Inside of the ascending triangle on a micro scale Bitcoin is forming a cup & handle, there is merit potentially for a inverted H&S as well.
The RSI is displaying a inverse H&S, interesting because the moving averages are about to converge
Only time will tell, but a golden cross followed by an immediate death cross seems like a future occurrence.
The RSI is displaying a inverse H&S, interesting because the moving averages are about to converge
Only time will tell, but a golden cross followed by an immediate death cross seems like a future occurrence.
ノート
You can see the inverse H&S well on a smaller time frame, and additionally, the bullish flag becomes apparent. I have placed three green arrows pointing sideways to the right that will either hold for a triple bottom or play out bearishly as a descending triangle once breaking below the bottom area of confluence.

免責事項
この情報および投稿は、TradingViewが提供または推奨する金融、投資、トレード、その他のアドバイスや推奨を意図するものではなく、それらを構成するものでもありません。詳細は利用規約をご覧ください。
免責事項
この情報および投稿は、TradingViewが提供または推奨する金融、投資、トレード、その他のアドバイスや推奨を意図するものではなく、それらを構成するものでもありません。詳細は利用規約をご覧ください。