検索
プロダクト
コミュニティ
マーケット
ブローカー
詳細
JA
始めましょう
BTCUSDT SPOT
ロング
8月1日
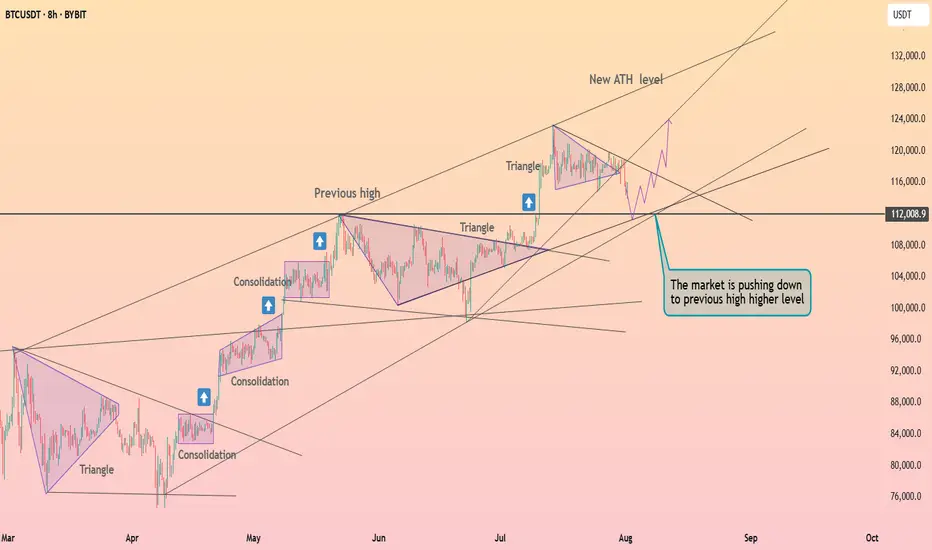
Bitcoin exited from the triangle ┆ HolderStat
4
このチャートを取得
このチャートを取得
1
1
147
BTCUSDT
is dipping to retest $112,000, the last breakout level. The price remains inside a large ascending triangle and may soon resume its uptrend. If this support holds, targets above $125,000 come back into play.
HolderStat
フォロー
他のメディア:
BTCUSD
btcusdanalysis
btcusdsignal
Chart Patterns
Technical Indicators
Trend Analysis
関連の投稿
Bitcoin is correcting ┆ HolderStat
HolderStatの投稿
Bitcoin is testing the boundaries of the triangle ┆ HolderStat
HolderStatの投稿
Bitcoin held the $115k level ┆ HolderStat
HolderStatの投稿
免責事項
この情報および投稿は、TradingViewが提供または推奨する金融、投資、トレード、その他のアドバイスや推奨を意図するものではなく、それらを構成するものでもありません。詳細は
利用規約
をご覧ください。
BTCUSD
btcusdanalysis
btcusdsignal
Chart Patterns
Technical Indicators
Trend Analysis
HolderStat
フォロー
他のメディア:
関連の投稿
Bitcoin is correcting ┆ HolderStat
HolderStatの投稿
Bitcoin is testing the boundaries of the triangle ┆ HolderStat
HolderStatの投稿
Bitcoin held the $115k level ┆ HolderStat
HolderStatの投稿
免責事項
この情報および投稿は、TradingViewが提供または推奨する金融、投資、トレード、その他のアドバイスや推奨を意図するものではなく、それらを構成するものでもありません。詳細は
利用規約
をご覧ください。