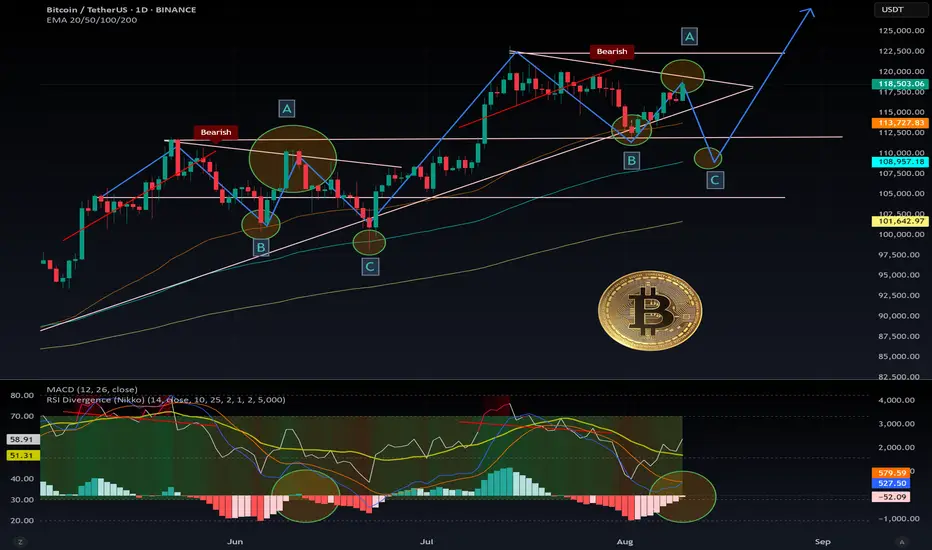
Bitcoin appears to be following the same repeating pattern we saw back in May–June 2025. On the Daily timeframe, a clear bull flag is forming, with both MACD and RSI confirming the setup.
In the previous instance, the pattern included two pullbacks before a strong rebound.
Currently, we’ve already seen a bounce off the 50 EMA, which acted as solid support.
You can clearly see the striking similarities, with both the MACD and RSI showing the same bearish divergence.
If history repeats itself, the likely scenario is:
- Rejection near the top resistance at $119.5k
- Pullback toward the 100 EMA to find support, signaling the end of the correction
The structure is mirroring the earlier move almost perfectly.
Key support levels: $115.6k, $112k, $109k, and in case of a deeper (low probability) pullback: $104k
Key resistance levels (possible rejection zones): $119.6k, $122.2k
If $122.2k is broken, we could be looking at a new ATH.
DYOR 📊
トレード稼働中
Hum... the Asia session pushed However there is a CME GAP at $117k. Usually Monday fills these, but who knows? I am waiting Monday low and high to see if the pattern is invalidated.
Twitter X: x.com/cryptonikkoid
Web: nikkoid.com
I do not answer to private messages. Use the comment section of the idea or script, or use Telegram.
Web: nikkoid.com
I do not answer to private messages. Use the comment section of the idea or script, or use Telegram.
免責事項
この情報および投稿は、TradingViewが提供または推奨する金融、投資、トレード、その他のアドバイスや推奨を意図するものではなく、それらを構成するものでもありません。詳細は利用規約をご覧ください。
