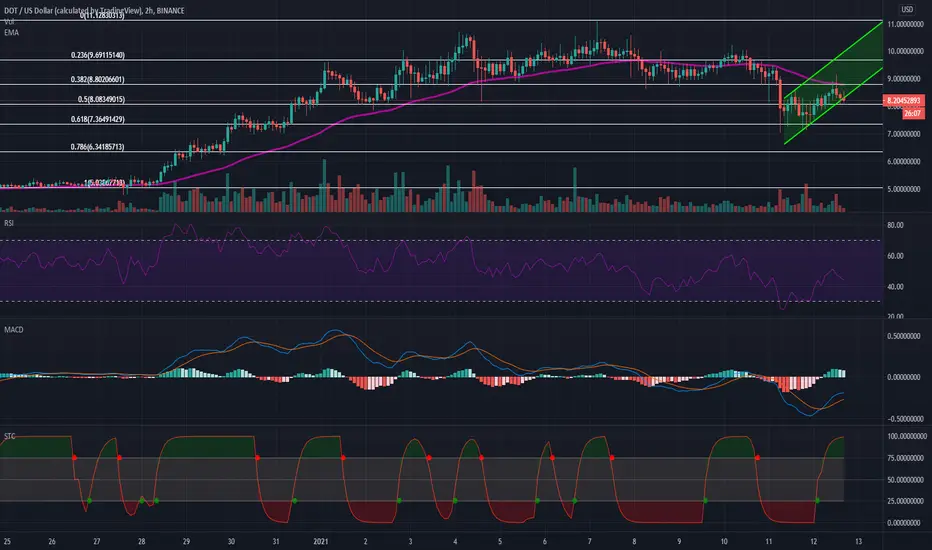
The technical chart reflects on the positive bounce back made by the price levels of Polkadot after touching the critical support area of $7.00 due to a downtrend from the past couple of trading sessions. A positive breakout above the 0.382fib level can surely be a bullish indication for the crypto asset for upcoming market sessions. On the contrary, a negative breakout from the falling channel pattern might indicate the existence of the bears.
The Relative Strength Index (RSI) looked to regain bullish levels after suffering negative breakouts to the oversold region while standing at 47.65.
The Schaff Trend Cycle (STC) has indicated a buying signal during the current market session indicating potential positive momentum for the coin.
The Moving Average Convergence & Divergence (MACD) has formed a bullish crossover and the levels will be looking for a positive breakout above the histogram line.
免責事項
これらの情報および投稿は、TradingViewが提供または保証する金融、投資、取引、またはその他の種類のアドバイスや推奨を意図したものではなく、またそのようなものでもありません。詳しくは利用規約をご覧ください。
免責事項
これらの情報および投稿は、TradingViewが提供または保証する金融、投資、取引、またはその他の種類のアドバイスや推奨を意図したものではなく、またそのようなものでもありません。詳しくは利用規約をご覧ください。