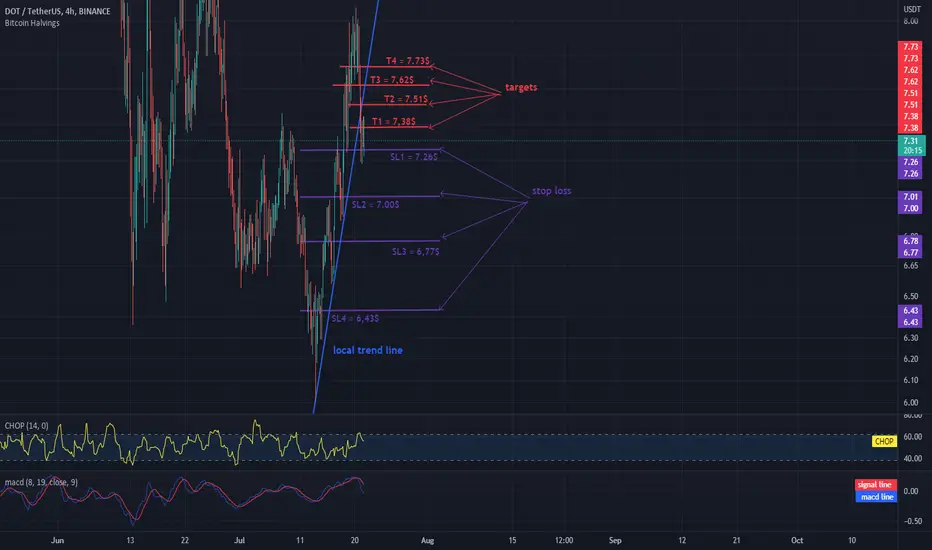
Hello everyone, let's take a look at the 4H DOT vs. USDT chart. As you can see, the price has dropped below the local uptrend line.
Let's start by setting goals for the near future that we can consider:
T1 = $ 7.38
T2 = $ 7.51
T3 = $ 7.62
and
T4 = $ 7.73
Now let's move on to the stop loss in case of further market declines:
SL1 = $ 7.26
SL2 = $ 7.00
SL3 = $ 6.77
and
SL4 = $ 6.43
Looking at the CHOP indicator, we can see that in the 4H range we still have a lot of energy, while the MACD indicator shows a local downward trend.
免責事項
この情報および投稿は、TradingViewが提供または推奨する金融、投資、トレード、その他のアドバイスや推奨を意図するものではなく、それらを構成するものでもありません。詳細は利用規約をご覧ください。
免責事項
この情報および投稿は、TradingViewが提供または推奨する金融、投資、トレード、その他のアドバイスや推奨を意図するものではなく、それらを構成するものでもありません。詳細は利用規約をご覧ください。