📊 Current Price
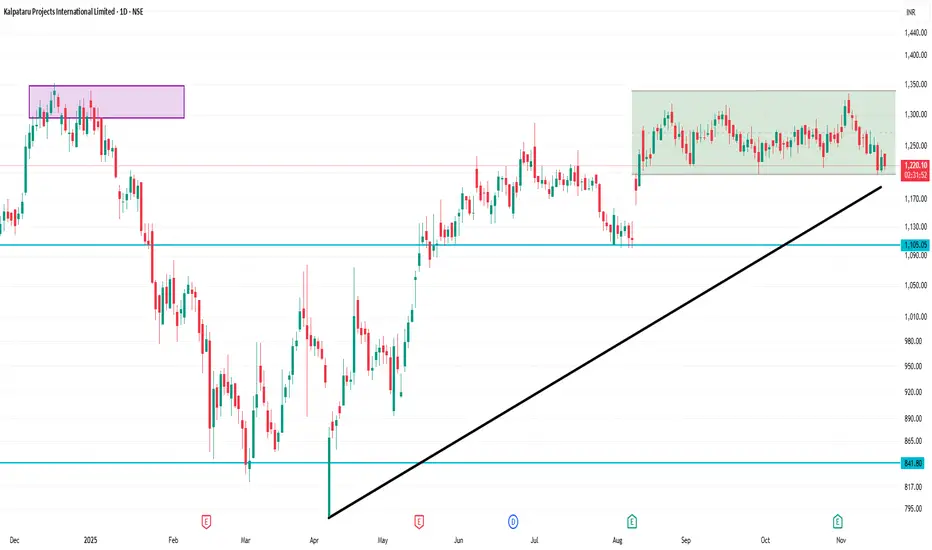
Last traded around ₹1,226.90 (as of about 11:58 AM IST on 20 Nov 2025) on NSE.
Day’s low ≈ ₹1,213.10, day’s high ≈ ₹1,239.30.
52-week range: Low ~ ₹786.30, High ~ ₹1,352.85.
✅ Interpretation & Notes
The stock is hovering near the ~₹1,225 level — which is near the 100-day MA, so it’s at a kind of technical crossroads.
With the price range for the day being relatively narrow (~₹1,213 to ~₹1,239), it suggests limited intraday volatility so far.
The gap between recent price and 52-week high (~₹1,352) indicates potential upside but that will depend on catalyst and momentum.
However, if the stock fails to hold above the ~₹1,200 support zone, it could drift toward weaker levels.
関連の投稿
免責事項
この情報および投稿は、TradingViewが提供または推奨する金融、投資、トレード、その他のアドバイスや推奨を意図するものではなく、それらを構成するものでもありません。詳細は利用規約をご覧ください。
関連の投稿
免責事項
この情報および投稿は、TradingViewが提供または推奨する金融、投資、トレード、その他のアドバイスや推奨を意図するものではなく、それらを構成するものでもありません。詳細は利用規約をご覧ください。