Litecoin (LTC) technical analysis:
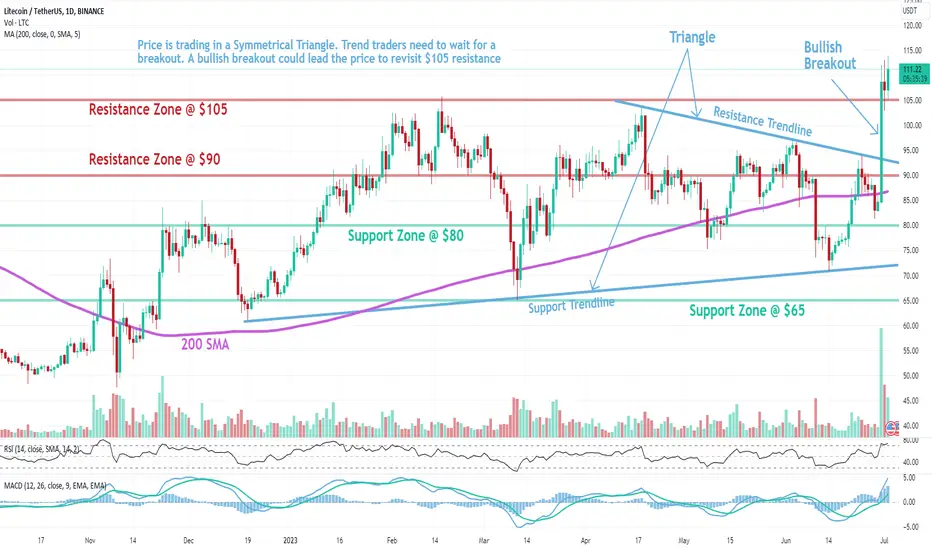
Trade setup: Price is trading in a Symmetrical Triangle. Trend traders need to wait for a breakout. A bullish breakout could lead the price to revisit $105 resistance
Pattern: Symmetrical Triangle, which is a neutral pattern, suggesting indecision in the market. Although it could break either up or down, it usually breaks in the direction of the prevailing trend (i.e. continuation not reversal).
Trend: Uptrend on Short-Term basis, Neutral on Medium-Term basis and Downtrend on Long-Term basis.
Momentum is Bullish (MACD Line is above MACD Signal Line and RSI is above 55).
Support and Resistance: Nearest Support Zone is $80, then $65. The nearest Resistance Zone is $90, which it broke then $105.
免責事項
これらの情報および投稿は、TradingViewが提供または保証する金融、投資、取引、またはその他の種類のアドバイスや推奨を意図したものではなく、またそのようなものでもありません。詳しくは利用規約をご覧ください。
免責事項
これらの情報および投稿は、TradingViewが提供または保証する金融、投資、取引、またはその他の種類のアドバイスや推奨を意図したものではなく、またそのようなものでもありません。詳しくは利用規約をご覧ください。