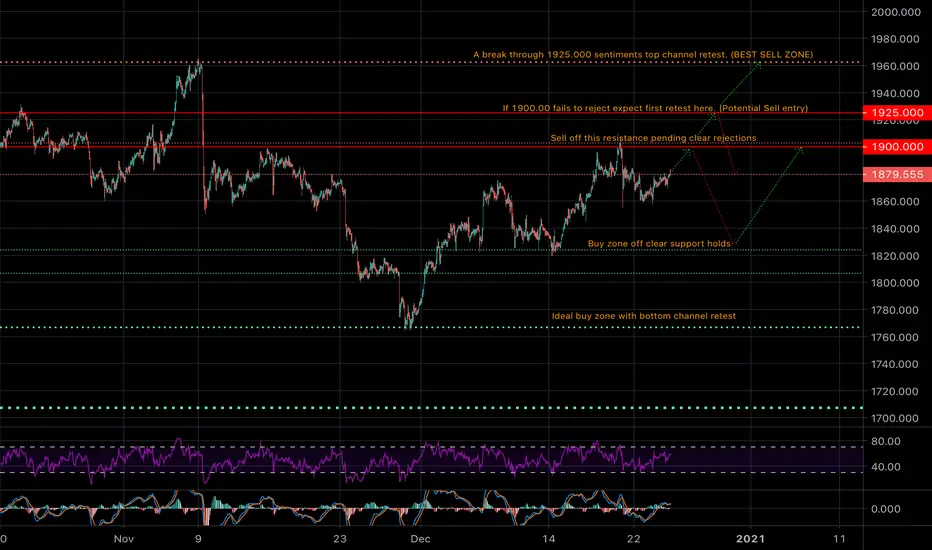
Presented is my sentiment on trade entry points off key supports and resistance within current top/bottom channel.
In August we matched the previous high and went into a down trend. I attached my fundamental post which ultimately explains the drop.
Currently we are trading in a channel between the high of 19600.000 and low of 1765.000
Presented on the chart are entry points within the channel that can yield immediate profits. A break out this channel would require new levels to be mapped out. I advise only placing trades at these levels that I specified on the chart.
The arrows represent potential direction off support/resistance play outs
Again my previous gold post is fundamental and attached to this post. Please comment with any thoughts and ideas. Thank you!
関連の投稿
免責事項
これらの情報および投稿は、TradingViewが提供または保証する金融、投資、取引、またはその他の種類のアドバイスや推奨を意図したものではなく、またそのようなものでもありません。詳しくは利用規約をご覧ください。
免責事項
これらの情報および投稿は、TradingViewが提供または保証する金融、投資、取引、またはその他の種類のアドバイスや推奨を意図したものではなく、またそのようなものでもありません。詳しくは利用規約をご覧ください。