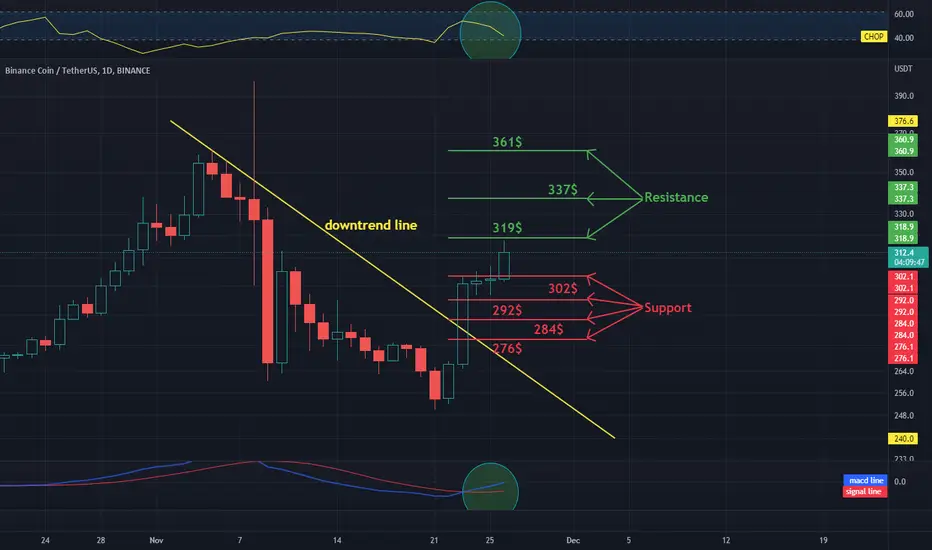
Hello everyone, let's look at the BNB to USDT 1 day chart. As you can see, the price has moved above the downtrend line.
Let's start with the support line and as you can see the first support we should consider is $302, if the support is broken then the next support is $292, $284 and $276.
Now let's go from the resistance line, as you can see the first resistance is $319, if you manage to break it, the next resistance will be $337 and $361.
Looking at the CHOP indicator, we see that most of the energy has been used on the one-day time frame, while the MACD indicator indicates a local uptrend.
免責事項
この情報および投稿は、TradingViewが提供または推奨する金融、投資、トレード、その他のアドバイスや推奨を意図するものではなく、それらを構成するものでもありません。詳細は利用規約をご覧ください。
免責事項
この情報および投稿は、TradingViewが提供または推奨する金融、投資、トレード、その他のアドバイスや推奨を意図するものではなく、それらを構成するものでもありません。詳細は利用規約をご覧ください。