Use this as a guide to develop your view.
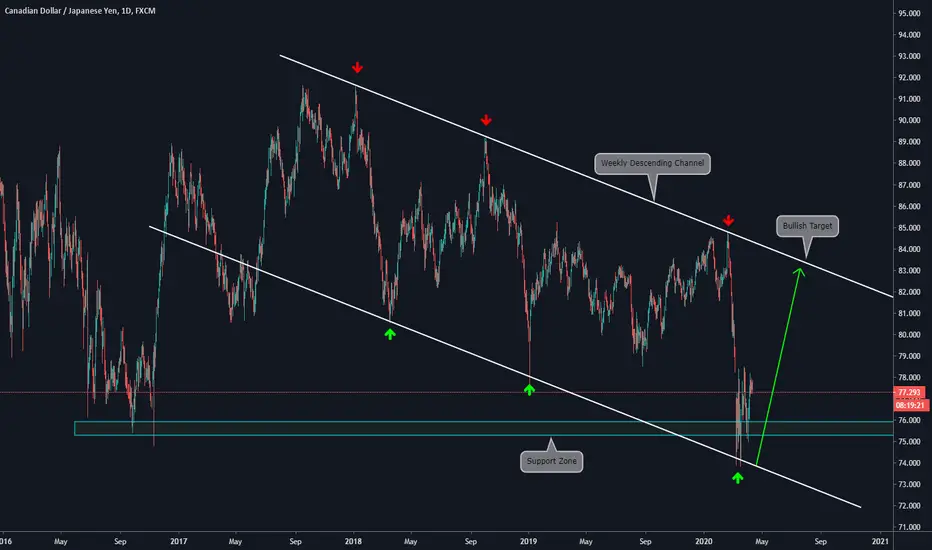
Main items we can see on the Daily Chart:
a)The price is inside a descending channel
b)Currently, the price is on the lower trendline of the descending channel
c)Also, we have a massive Support zone on 75 - 76
d)The convergence between the Support zone + the lower trendline of the descending channel, provide us with a clear reversal zone
e)Our long term target for the bullish movement will be the higher trendline of the descending channel.
免責事項
これらの情報および投稿は、TradingViewが提供または保証する金融、投資、取引、またはその他の種類のアドバイスや推奨を意図したものではなく、またそのようなものでもありません。詳しくは利用規約をご覧ください。
免責事項
これらの情報および投稿は、TradingViewが提供または保証する金融、投資、取引、またはその他の種類のアドバイスや推奨を意図したものではなく、またそのようなものでもありません。詳しくは利用規約をご覧ください。