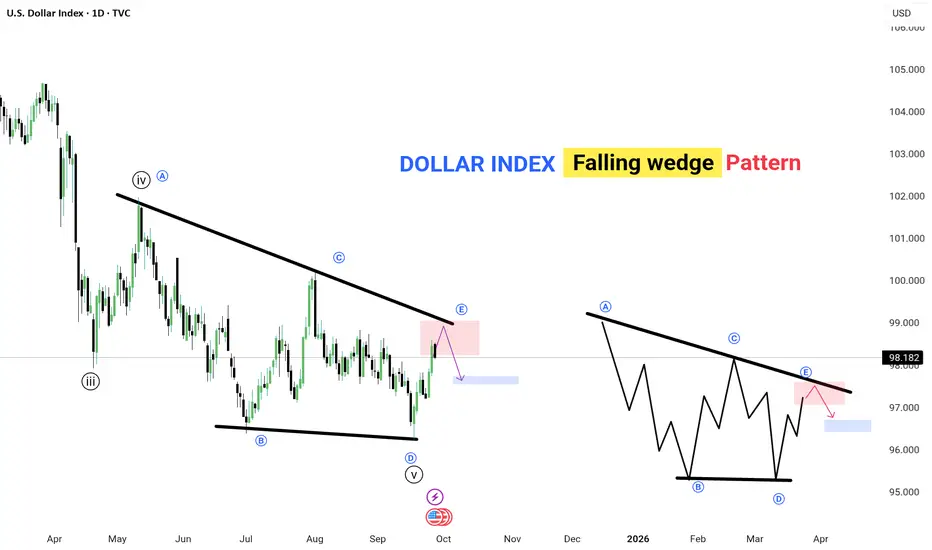
📉 The Dollar Index is forming a falling wedge, a classic reversal pattern.
🔹 Price is approaching the upper trendline resistance (point E).
🔹 Expect a potential pullback toward the support zone (highlighted in blue).
🔹 Pattern repeats: After E, a corrective dip is likely before the next move.
✅ Key Points:
Falling wedge usually signals trend reversal or continuation.
Watch for breakout confirmation above resistance for bullish continuation.
Current focus: resistance zone near 98–98.2, then potential drop to 96–97 support.
💡 Lesson: Patience pays — wait for clear rejection or breakout before trading this setup.
---
関連の投稿
免責事項
これらの情報および投稿は、TradingViewが提供または保証する金融、投資、取引、またはその他の種類のアドバイスや推奨を意図したものではなく、またそのようなものでもありません。詳しくは利用規約をご覧ください。
免責事項
これらの情報および投稿は、TradingViewが提供または保証する金融、投資、取引、またはその他の種類のアドバイスや推奨を意図したものではなく、またそのようなものでもありません。詳しくは利用規約をご覧ください。