MATIC/USDT - Targets and Stoploss
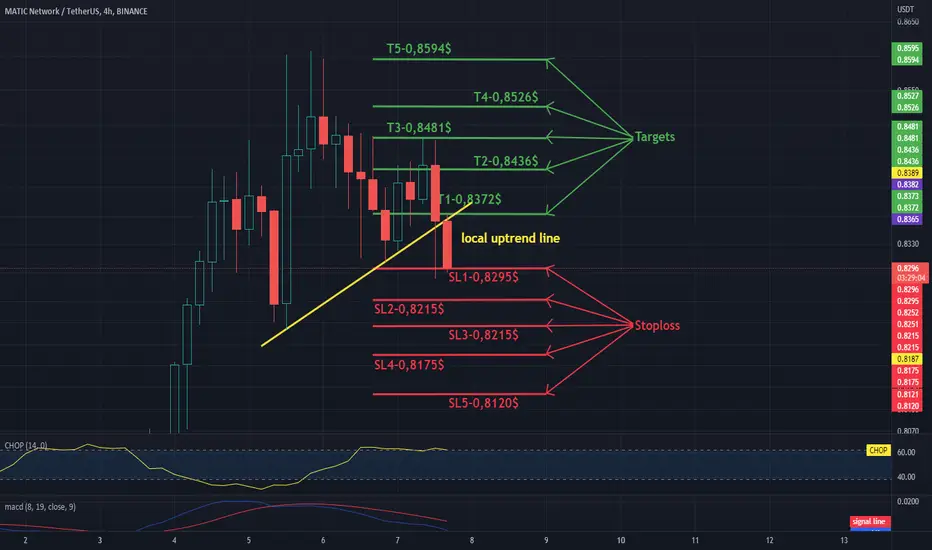
Hello everyone, let's take a look at the 4H MATIC to USDT chart as you can see the price is moving below the local uptrend line.
Let's start by setting goals for the near future that we can consider:
T1 - $ 0.8372
T2 - $ 0.8436
T3 - $ 0.8481
T4 - $ 0.8526
and
T5 - $ 0.8594
Now let's move on to the stop loss in case of further market declines:
SL1 - $ 0.8295
SL2 - $ 0.8215
SL3 - $ 0.8215
SL4 - $ 0.8175
and
SL5 - $ 0.8120
Looking at the CHOP indicator, we can see that we have a lot of energy in the 4H range, while the MACD indicator shows a local downward trend.
免責事項
これらの情報および投稿は、TradingViewが提供または保証する金融、投資、取引、またはその他の種類のアドバイスや推奨を意図したものではなく、またそのようなものでもありません。詳しくは利用規約をご覧ください。
免責事項
これらの情報および投稿は、TradingViewが提供または保証する金融、投資、取引、またはその他の種類のアドバイスや推奨を意図したものではなく、またそのようなものでもありません。詳しくは利用規約をご覧ください。