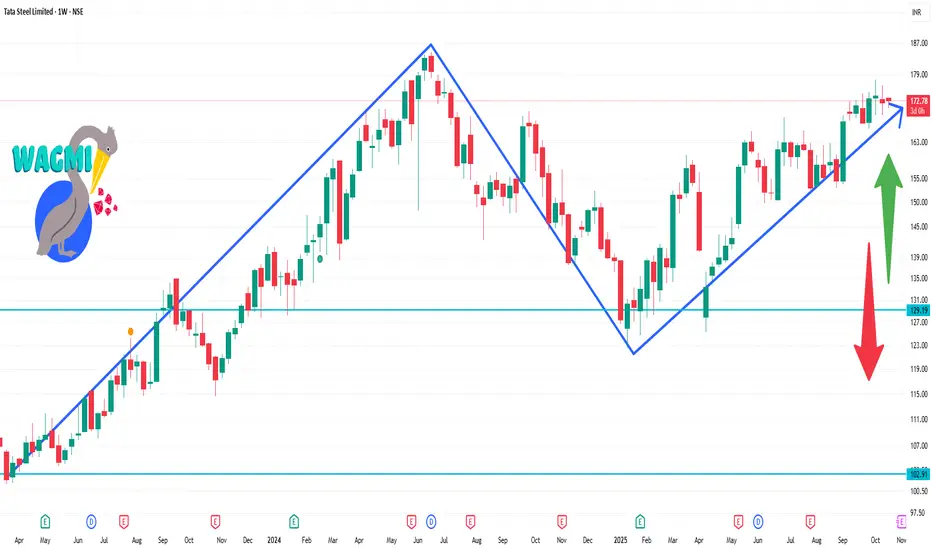
✅ Current Technical Picture
The stock is trading around ₹172.
On the weekly time-frame, one source flags a “Strong Buy”.
On the short term (1-week/moving averages/oscillators), other sources show caution:
One platform shows the 1-week summary as “Bearish” (moving averages & oscillators) for the week-frame.
Support levels are mentioned around ₹167-169 and further around ~₹157 in case of deeper pull-back.
Resistance or recent highs near the ~₹173-175 zone.
🎯 Key Levels to Watch (1-week horizon)
Support:
First support around ~ ₹167-169. (If price dips)
A deeper support/accumulated volume zone near ~ ₹157-160 if weakness extends.
Resistance / Ceiling:
Near term resistance ~ ₹172-175. Price recently around that level.
If bullish momentum builds, breakout above ~₹175 could open further upside (but stronger risk).
関連の投稿
免責事項
この情報および投稿は、TradingViewが提供または推奨する金融、投資、トレード、その他のアドバイスや推奨を意図するものではなく、それらを構成するものでもありません。詳細は利用規約をご覧ください。
関連の投稿
免責事項
この情報および投稿は、TradingViewが提供または推奨する金融、投資、トレード、その他のアドバイスや推奨を意図するものではなく、それらを構成するものでもありません。詳細は利用規約をご覧ください。