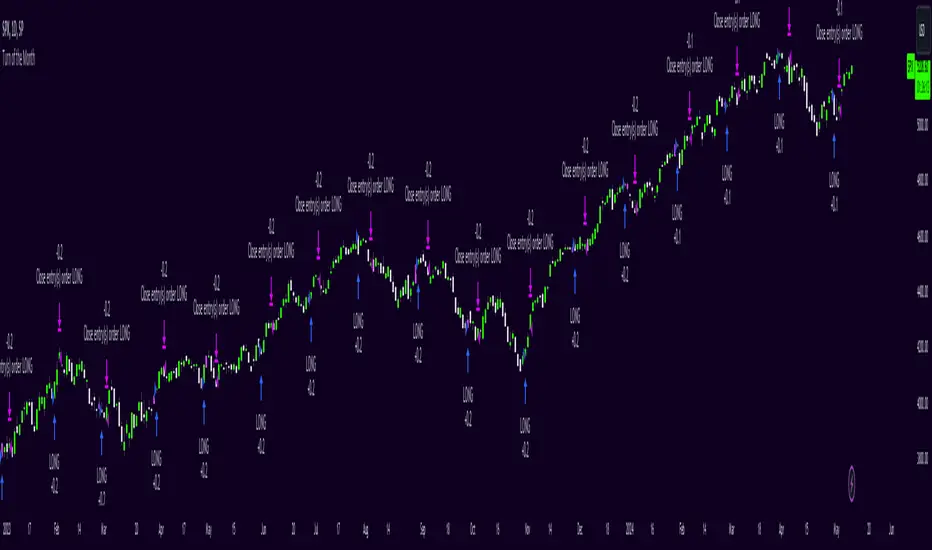
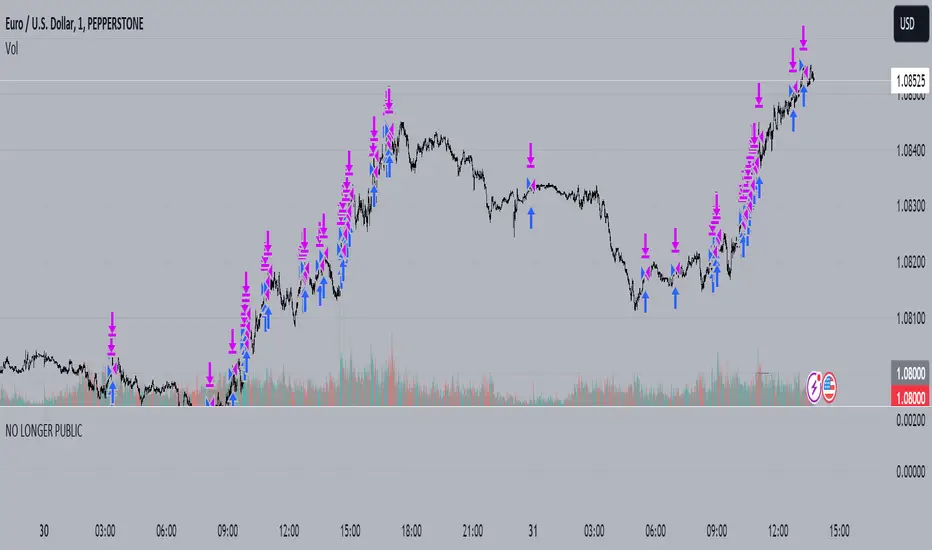
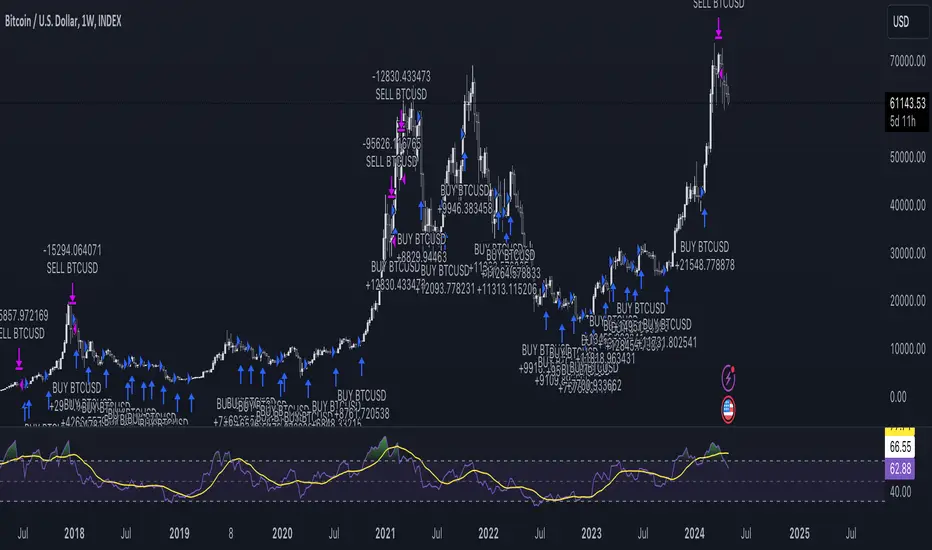
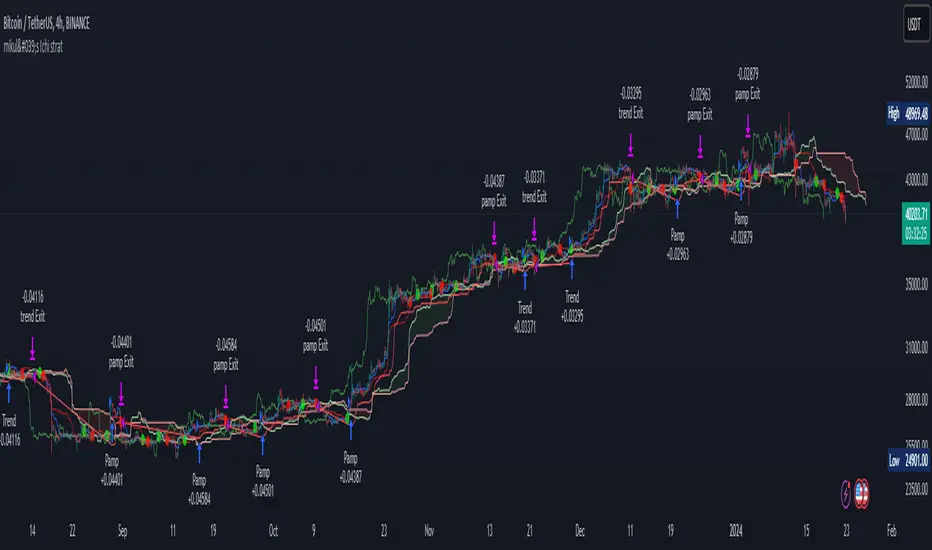
What is Linear Regression? (English) www.tradingview.com (English) www.tradingview.com (Russian) Link This script Straight lines show the last linear regression channel. The smooth lines show the coordinates of the same channel in the past. This allows you to backtest this strategy using past prices. It also makes sure that the linear regression channel...
Simple way how to use Linear Regression for trading. What we use: • Linear Regression • EMA 200 as a trend filter Logic: Firstly we make two different linear regression movings as oscillator. For this we need to subtract slow moving from fast moving, so we get the single moving around zero. This is the green/red line which appears on the chart. The trade open...
This strategy is taken from Perry Kaufman's book "Trading System and Methods". You can enter on the direction of the candle, or opposite to it. I find that the opposite tends to yield better results in volatile assets, allowing a better reward to risk ratio. There is no stop loss in this strategy, only a fixed take profit and a time limitation.
This video is a detailed video overview of the _CM_Ultimate_MA_MTF_V4 - Multiple Time Frame - V4 Release. I will post the link to the Indicator within a few minutes after this video goes live on TradingView either in the Link to Related Ideas below, or I'll post a comment below with the link. Thanks for you patience. Please Post and feature requests for this...
Thanks to your advices I removed in this version something that was not necessary for the strategy but added alert and the chart of the current state of the strategy (white 1 - in trade, 0 - out of trade).
This strategy is based on a custom indicator that was created based on the Supertrend indicator. At its core, there are always 2 super trend indicators with different factors to reduce market noise (false signals). The strategy/indicator has some parameters to improve the signals and filters. TECHNICAL ANALYSIS ☑ Show Indicators This option will...
This strategy generates swing trading signals based on the Golden Ratio Breakout. This is a long-only strategy, entry is breakout and retest of 38.2 fib level and SL is 23.6 fib level from last 21 days. These are only suggestions and NOT recommendations. Please do your own due diligence before taking ANY action. No responsibility for any profits/LOSSES.
This strategy is based on LonesomeTheBlue's Linear Regression Channel Indicator. First of all, I would like to thank LonesomeTheBlue. Breaking the Linear Regression Channel to close the candle triggers a Long or Short signal. If the slope of the Linear Regression Channel is positive, it is Short when it breaks out the lower line, and when the slope is negative, it...
This is an example of constructing P-Signal strategy on a set of probability spaces. In this case, the daily weekly and monthly time frames are used. Please note that the parameters for each of the spaces (the number of bars in the gear) are different.
This is an example of building a trading strategy based on a p-signal. The p-signal indicates the entropy of the state of the D frame system for the BTCUSD pair in the Kolmogorov probability space.
This is combo strategies for get a cumulative signal. First strategy This System was created from the Book "How I Tripled My Money In The Futures Market" by Ulf Jensen, Page 183. This is reverse type of strategies. The strategy buys at market, if close price is higher than the previous close during 2 days and the meaning of 9-days Stochastic Slow...
Hello, everyone! We have just released an innovative strategy for TradingView. It allows you to facilitate the trading process when you have to use both indicators. This strategy is: User-friendly Configurable Equipped with the combination of Relative Strength Index (RSI) and Moving Average (MA) indicators Designed with all required functions to manage...
Hello, everyone! We have just released an innovative strategy for TradingView. It allows you to identify price pivot points and volatility. This strategy is: User-friendly Configurable Equipped with Bollinger Bands and smoothed ATR to measure volatility Features Thanks to the BB Fibo strategy, you can: Trade stocks and commodities. Identify...
This is another version of my ZZ type strategy. This script now uses Bill Williams' fractals. Strategy Step 1: Calculate Bill Williams' Fractals Step 2. A line is drawn from the fractal Step 3. Create a stop order to enter the position on the line Trading If the price is above the lime line, open a long position (and close a short position). If the price...
Simple EMA Crossing strategy, based on crossover Fast exponential moving average = EMA21 and Slow exponential moving average = EMA55. Default stop loss is 3%, but you can change it. Default take profit is 9%, it based on stop loss. Risk to Reward ratio is 1 to 3. Strategy was tested on BTCUSDT 1H timeframe and works fine with these parameters.
Backtesting indicators is easy , just add the following line of code to your script: plot(longEntry ? 1 : shortEntry ? -1 : longTP ? 0.5 : shortTP ? -0.5 : 0, color=na, editable=false, title='Backtest') These numbers are defined as constants in the backtester source-code. After adding this indicator to your chart: 1. Open Settings 2. Select supported...
As the title already describes: this is a Donchian breakout strategy. This strategy, as of now, only goes long. It goes long when the price close makes a new high and the 8 day moving average is above the 32 day moving average. The strategy exits the trade if the price breaks the atr trailing stop of * 3 or the 8 day moving average crosses below the 32 day moving...
Simple and efficient multi moving average strategy combined with risk management and time condition. Indicators/ Tools used Multi selection moving average type like SMA , EMA , SMMA , VWMA , VIDYA , FRAMA , T3 and much more Limit 1 entry max per week, entry on monday exit on sunday or risk management tp/sl. Rules for entry: LONG:Close of the candle cross above...