rt maax EMA cross strategythis just sample of our strategies we published with open source, to learning our investor the way of trading and analysis, this strategy just for study and learning
in this strategy we use expontial moving avarage 20 , 50 , 200 and the we build this strategy when the price move up ema 200 and ema 20,50 cross up the 200 ema in this conditions the strargey will open long postion
and the oppisit it is true for short postion in this sitation the price should be under ema 200 and the ema 20 , 50 should cross under 200 ema then the strategy will open the short postion
we try this strategy on forex ,crypto and futures and it give us very good result ,, also we try this postion on multi time frame we find the stragey give us good result on 1 hour time frame .
in the end our advice for you before you use any stratgy you should have the knowledg of the indecators how it is work and also you should have information about the market you trade and the last news for this market beacuse it effect so much on the price moving .
so we hope this strategy give you brefing of the way we work and build our strategy
トレンド分析

Multi Trend Cross Strategy TemplateToday I am sharing with the community trend cross strategy template that incorporates any combination of over 20 built in indicators. Some of these indicators are in the Pine library, and some have been custom coded and contributed over time by the beloved Pine Coder community. Identifying a trend cross is a common trend following strategy and a common custom-code request from the community. Using this template, users can now select from over 400 different potential trend combinations and setup alerts without any custom coding required. This Multi-Trend cross template has a very inclusive library of trend calculations/indicators built-in, and will plot any of the 20+ indicators/trends that you can select in the settings.
How it works : Simple trend cross strategies go long when the fast trend crosses over the slow trend, and/or go short when the fast trend crosses under the slow trend. Options for either trend direction are built-in to this strategy template. The script is also coded in a way that allows you to enable/modify pyramid settings and scale into a position over time after a trend has crossed.
Use cases : These types of strategies can reduce the volatility of returns and can help avoid large market downswings. For instance, those running a longer term trend-cross strategy may have not realized half the down swing of the bear markets or crashes in 02', 08', 20', etc. However, in other years, they may have exited the market from time to time at unfavorable points that didn't end up being a down turn, or at times the market was ranging sideways. Some also use them to reduce volatility and then add leverage to attempt to beat buy/hold of the underlying asset within an acceptable drawdown threshold.
Special thanks to @Duyck, @everget, @KivancOzbilgic and @LazyBear for coding and contributing earlier versions of some of these custom indicators in Pine.
This script incorporates all of the following indicators. Each of them can be selected and modified from within the indicator settings:
ALMA - Arnaud Legoux Moving Average
DEMA - Double Exponential Moving Average
DSMA - Deviation Scaled Moving Average - Contributed by Everget
EMA - Exponential Moving Average
HMA - Hull Moving Average
JMA - Jurik Moving Average - Contributed by Everget
KAMA - Kaufman's Adaptive Moving Average - Contributed by Everget
LSMA - Linear Regression , Least Squares Moving Average
RMA - Relative Moving Average
SMA - Simple Moving Average
SMMA - Smoothed Moving Average
Price Source - Plotted based on source selection
TEMA - Triple Exponential Moving Average
TMA - Triangular Moving Average
VAMA - Volume Adjusted Moving Average - Contributed by Duyck
VIDYA - Variable Index Dynamic Average - Contributed by KivancOzbilgic
VMA - Variable Moving Average - Contributed by LazyBear
VWMA - Volume Weighted Moving Average
WMA - Weighted Moving Average
WWMA - Welles Wilder's Moving Average
ZLEMA - Zero Lag Exponential Moving Average - Contributed by KivancOzbilgic
Disclaimer : This is not financial advice. Open-source scripts I publish in the community are largely meant to spark ideas that can be used as building blocks for part of a more robust trade management strategy. If you would like to implement a version of any script, I would recommend making significant additions/modifications to the strategy & risk management functions. If you don’t know how to program in Pine, then hire a Pine-coder. We can help!

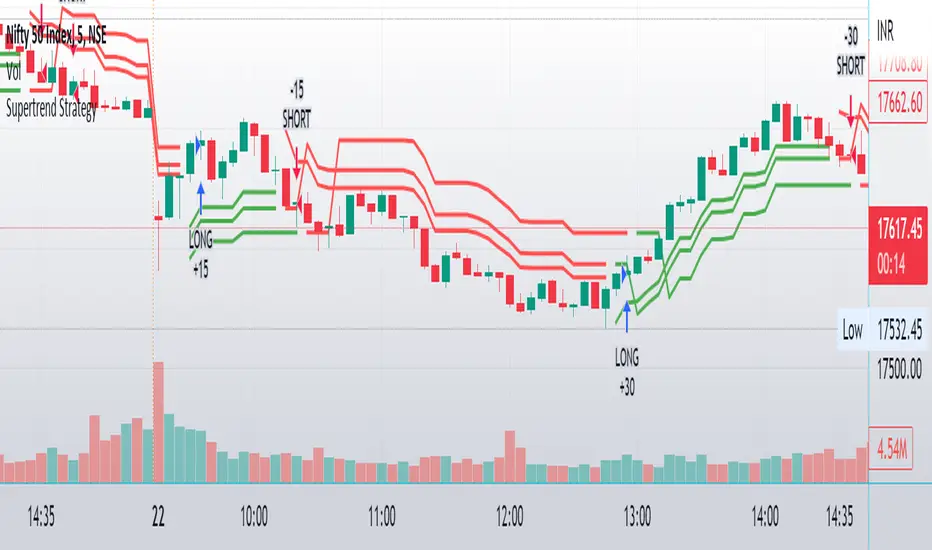
SuperTrend Multi Time Frame Long and Short Trading Strategy
Hello All
This is non-repainting Supertrend Multi Time Frame script, I got so many request on Supertrend with Multi Time Frame. This is for all of them ..I am making it open for all so you can change its coding according to your need.
How the Basic Indicator works
SuperTrend is one of the most common ATR based trailing stop indicators.
In this version you can change the ATR calculation method from the settings. Default method is RMA.
The indicator is easy to use and gives an accurate reading about an ongoing trend. It is constructed with two parameters, namely period and multiplier. The default values used while constructing a Supertrend indicator are 10 for average true range or trading period and three for its multiplier.
The average true range (ATR) plays an important role in 'Supertrend' as the indicator uses ATR to calculate its value. The ATR indicator signals the degree of price volatility .
The buy and sell signals are generated when the indicator starts plotting either on top of the closing price or below the closing price. A buy signal is generated when the ‘Supertrend’ closes above the price and a sell signal is generated when it closes below the closing price.
It also suggests that the trend is shifting from descending mode to ascending mode. Contrary to this, when a ‘Supertrend’ closes above the price, it generates a sell signal as the colour of the indicator changes into red.
A ‘Supertrend’ indicator can be used on spot, futures, options or forex, or even crypto markets and also on daily, weekly and hourly charts as well, but generally, it fails in a sideways-moving market.
How the Strategy works
This is developed based on SuperTrend.
Use two time frame for confirm all entry signals.
Two time frame SuperTrend works as Trailing stop for both long and short positions.
More securely execute orders, because it is wait until confine two time frames(example : daily and 30min)
Each time frame developed as customisable for user to any timeframe.
User can choose trading position side from Long, Short, and Both.
Custom Stop Loss level, user can enter Stop Loss percentage based on timeframe using.
Multiple Take Profit levels with customisable TP price percentage and position size.
Back-testing with custom time frame.
This strategy is develop for specially for automation purpose.
The strategy includes:
Entry for Long and Short.
Take Profit.
Stop Loss.
Trailing Stop Loss.
Position Size.
Exit Signal.
Risk Management Feature.
Backtesting.
Trading Alerts.
Use the strategy with alerts
This strategy is alert-ready. All you have to do is:
Go on a pair you would like to trade
Create an alert
Select the strategy as a Trigger
Wait for new orders to be sent to you
This is develop for specially for automating trading on any exchange, if you need to get that automating service for this strategy or any Tradingview strategy or indicator please contact me I am have 8 year experience on that field.
I hope you enjoy it!
Thanks,
Ranga

Ichimoku Cloud and ADX with Trailing Stop Loss (by Coinrule)The Ichimoku Cloud is a collection of technical indicators that show support and resistance levels, as well as momentum and trend direction. It does this by taking multiple averages and plotting them on a chart. It also uses these figures to compute a “cloud” that attempts to forecast where the price may find support or resistance in the future.
The Ichimoku Cloud was developed by Goichi Hosoda, a Japanese journalist, and published in the late 1960s. It provides more data points than the standard candlestick chart. While it seems complicated at first glance, those familiar with how to read the charts often find it easy to understand with well-defined trading signals.
The Ichimoku Cloud is composed of five lines or calculations, two of which comprise a cloud where the difference between the two lines is shaded in.
The lines include a nine-period average, a 26-period average, an average of those two averages, a 52-period average, and a lagging closing price line.
The cloud is a key part of the indicator. When the price is below the cloud, the trend is down. When the price is above the cloud, the trend is up.
The above trend signals are strengthened if the cloud is moving in the same direction as the price. For example, during an uptrend, the top of the cloud is moving up, or during a downtrend, the bottom of the cloud is moving down.
DMI is simple to interpret. When +DI > - DI, it means the price is trending up. On the other hand, when -DI > +DI , the trend is weak or moving on the downside. The ADX does not give an indication about the direction but about the strength of the trend.
Typically values of ADX above 25 mean that the trend is steeply moving up or down, based on the -DI and +D positioning. This script aims to capture swings in the DMI, and thus, in the trend of the asset, using a contrarian approach.
Trading on high values of ADX, the strategy tries to spot extremely oversold and overbought conditions. Values of ADX above 45 may suggest that the trend has overextended and is may be about to reverse.
This strategy combines the Ichimoku Cloud with the ADX indicator to better enter trades.
Long orders are placed when these basic signals are triggered.
Long Position:
Tenkan-Sen is above the Kijun-Sen
Chikou-Span is above the close of 26 bars ago
Close is above the Kumo Cloud
MACD line crosses over the signal line
-DI is greater than +DI
ADX is greater than 45
Close Position:
3% increase trailing
3% decrease trailing
The script is backtested from 1 January 2018 and provides good returns.
The strategy assumes each order is using 30% of the available coins to make the results more realistic and to simulate you only ran this strategy on 30% of your holdings. A trading fee of 0.1% is also taken into account and is aligned to the base fee applied on Binance.
This script also works well on MATIC (1d timeframe), ETH (1d timeframe), and SOL (1d timeframe).

[Sniper] SuperTrend + SSL Hybrid + QQE MODHi. I’m DuDu95.
**********************************************************************************
This is the script for the series called "Sniper".
*** What is "Sniper" Series? ***
"Sniper" series is the project that I’m going to start.
In "Sniper" Series, I’m going to "snipe and shoot" the youtuber’s strategy: to find out whether the youtuber’s video about strategy is "true or false".
Specifically, I’m going to do the things below.
1. Implement "Youtuber’s strategy" into pinescript code.
2. Then I will "backtest" and prove whether "the strategy really works" in the specific ticker (e.g. BTCUSDT) for the specific timeframe (e.g. 5m).
3. Based on the backtest result, I will rate and judge whether the youtube video is "true" or "false", and then rate the validity, reliability, robustness, of the strategy. (like a lie detector)
*** What is the purpose of this series? ***
1. To notify whether the strategy really works for the people who watched the youtube video.
2. To find and build my own scalping / day trading strategy that really works.
**********************************************************************************
*** Strategy Description ***
This strategy is from " QQE MOD + supertrend + ssl hybrid" by korean youtuber "코인투데이".
"코인투데이" claimed that this strategy will make you a lot of money in any crypto ticker in 15 minute timeframe.
### Entry Logic
1. Long Entry Logic
- Super Trend Short -> Long
- close > SSL Hybrid baseline upper k
- QQE MOD should be blue
2. Short Entry Logic
- Super Trend Long -> Short
- close < SSL Hybrid baseline lower k
- QQE MOD should be red
### Exit Logic
1. Long Exit Logic
- Super Trend Long -> Short
2. Short Entry Logic
- Super Trend Short -> Long
### StopLoss
1. Can Choose Stop Loss Type: Percent, ATR, Previous Low / High.
2. Can Chosse inputs of each Stop Loss Type.
### Take Profit
1. Can set Risk Reward Ratio for Take Profit.
- To simplify backtest, I erased all other options except RR Ratio.
- You can add Take Profit Logic by adding options in the code.
2. Can set Take Profit Quantity.
### Risk Manangement
1. Can choose whether to use Risk Manangement Logic.
- This controls the Quantity of the Entry.
- e.g. If you want to take 3% risk per trade and stop loss price is 6% below the long entry price,
then 50% of your equity will be used for trade.
2. Can choose How much risk you would take per trade.
### Plot
1. Added Labels to check the data of entry / exit positions.
2. Changed and Added color different from the original one. (green: #02732A, red: #D92332, yellow: #F2E313)
3. SuperTrend and SSL Hybrid Baseline is by default drawn on the chart.
4. If you check EMA filter, EMA would be drawn on the chart.
5. Should add QQE MOD indicator manually if you want to see QQE MOD.
**********************************************************************************
*** Rating: True or False?
### Rating:
→ 3.5 / 5 (0 = Trash, 1 = Bad, 2 = Not Good, 3 = Good, 4 = Great, 5 = Excellent)
### True or False?
→ True but not a 'perfect true'.
→ It did made a small profit on 15 minute timeframe. But it made a profit so it's true.
→ It worked well in longer timeframe. I think super trend works well so I will work on this further.
### Better Option?
→ Use this for Day trading or Swing Trading, not for Scalping. (Bigger Timeframe)
→ Although the result was not good at 15 minute timeframe, it was quite profitable in 1h, 2h, 4h, 8h, 1d timeframe.
→ Crypto like BTC, ETH was ok.
→ The result was better when I use EMA filter.
### Robust?
→ Yes. Although result was super bad in 5m timeframe, backtest result was "consistently" profitable on longer timeframe (when timeframe was bigger than 15m, it was profitable).
→ Also, MDD was good under risk management option on.
**********************************************************************************
*** Conclusion?
→ I recommend you not to use this on short timeframe as the youtuber first mentioned.
→ In my opinion, I can use on longer timeframe like 2h or bigger with EMA filter, stoploss and risk management.

Catching the Bottom (by Coinrule)This script utilises the RSI and EMA indicators to enter and close the trade.
The relative strength index (RSI) is a momentum indicator used in technical analysis. RSI measures the speed and magnitude of a security's recent price changes to evaluate overvalued or undervalued conditions in the price of that security. The RSI is displayed as an oscillator (a line graph) on a scale of zero to 100. The RSI can do more than point to overbought and oversold securities. It can also indicate securities that may be primed for a trend reversal or corrective pullback in price. It can signal when to buy and sell. Traditionally, an RSI reading of 70 or above indicates an overbought situation. A reading of 30 or below indicates an oversold condition.
An exponential moving average (EMA) is a type of moving average (MA) that places a greater weight and significance on the most recent data points. The exponential moving average is also referred to as the exponentially weighted moving average. An exponentially weighted moving average reacts more significantly to recent price changes than a simple moving average simple moving average (SMA), which applies an equal weight to all observations in the period.
The strategy enters and exits the trade based on the following conditions.
ENTRY
RSI has a decrease of 3.
RSI <40.
EMA100 has crossed above the EMA50.
EXIT
RSI is greater than 65.
EMA9 has crossed above EMA50.
This strategy is back tested from 1 April 2022 to simulate how the strategy would work in a bear market and provides good returns.
Pairs that produce very strong results include ETH on the 5m timeframe, BNB on 5m timeframe, XRP on the 45m timeframe, MATIC on the 30m timeframe and MATIC on the 2H timeframe.
The strategy assumes each order is using 30% of the available coins to make the results more realistic and to simulate you only ran this strategy on 30% of your holdings. A trading fee of 0.1% is also taken into account and is aligned to the base fee applied on Binance.

Trailing Stop SnippetThis is an example snippet that should allow for adding a trailing stop and trailing stop activation to almost any script.
You can use it by setting a trailing stop alone. This will provide you standard trailing stop functionality allowing you to lock in profits and increase your stop-loss as the price moves in your direction.
You can also set the trailing stop activation to trigger the original trailing stop at a certain level. "Once price rises 5%, set a trailing stop at break even". This would be set as 5 and 5 in the settings.

[D] Dudu 95 Strategy Template ver.1.1.Hello Guys! Nice to meet you all!
This is my Second script after changing My Profile Name!
I updated my strategy template before - I added some filter conditions (EMA, ADX, DMI).
If there's something to update, I will update this script!
Thank you!
-----
I made this based on the open source strategies by jason5480, kevinmck100, myncrypto.
Thank you All!
### Filter
1. Can Choose whether to use filter.
2. Filters Based on ATR, EMA, ADX, and DMI are ready to use.
### StopLoss
1. Can Choose Stop Loss Type: Percent, ATR, Previous Low / High.
2. Can Chosse inputs of each Stop Loss Type.
### Take Profit
1. Can set Risk Reward Ratio for Take Profit.
- To simplify backtest, I erased all other options except RR Ratio.
- You can add Take Profit Logic by adding options in the code.
2. Can set Take Profit Quantity.
### Risk Manangement
1. Can choose whether to use Risk Manangement Logic.
- This controls the Quantity of the Entry.
- e.g. If you want to take 3% risk per trade and stop loss price is 6% below the long entry price,
then 50% of your equity will be used for trade.
2. Can choose How much risk you would take per trade.
### Plot
1. Added Labels to check the data of entry / exit positions.
2. Changed and Added color different from the original one. (green: #02732A, red: #D92332, yellow: #F2E313)

Strategy Myth-Busting #10 - InsideBar+EMA - [MYN]This is part of a new series we are calling "Strategy Myth-Busting" where we take open public manual trading strategies and automate them. The goal is to not only validate the authenticity of the claims but to provide an automated version for traders who wish to trade autonomously.
Our 10th one we are automating is the " 75% Win Rate High Profit Inside Bar Trading Strategy - What If You ... " strategy from " Trade Pro " who claims to have backtested this manually and achieved 11,063% profit with a 75% winrate over 100 trades. I was unable to emulate these results consistently accommodating for slippage and commission but even so, the results look promising. I was only able to achieve this win-rate with some multiple take profit staggering. Even so the markdown is above where I would normally consider comfortable (>20%).
If you know of or have a strategy you want to see myth-busted or just have an idea for one, please feel free to message me.
This strategy uses a combination of 2 open-source public indicators:
Inside Bar Ind/Alert by CMA
EMA (built-in)
Trading Rules
4 hour candles
Stop Loss at EMA Line with TP Target 1.5x the risk
Long Entry when these conditions are true
inside bar and bullish
Bar close's above 50 ema
Price action rises above high of inside bar .
Short Entry when these conditions are true
inside bar and bearish
Bar close below 50 ema
Price action falls below low of inside bar

[XRP][1h] Chanu Delta inspired — Breakeven StrategyHello, this is my first TV contribution. I usually don't publish anything but the script is a quick review of an other contributor (Chanu Delta V3 script )
I reverse engineered this indicator today as I wanted to test it on other contracts. The original version (which aims to be traded on BTC) has been ported to XRP (as btc and xrp prices are narrowly correlated) then modified with a couple of what I believe are improvements:
- No backtest bias even with `security` function.
- Extra backtest bias validation, always trading on next bar as Crossover/under bias is confirmed
- Backtest with 2 ajustable TP, ajustable equity and breakeven option
- The current version is not design to use pyramiding as it would require extra logic to monitor the lifecycle of the position in the context of a study.
- Commented alerts examples with variables available in script scope so you can use them in alerts (just replace strategy with indicator and remove backtest related code block).
- Trade filling assumption set to 10, fees to 0.02 as the are default bybit maker fees and I advice to enter with trailing orders using a max of 2 ticks as offset to lower fees rather than a market order!
- Backtest and Alerts happen on barclose.
- No repaint guaranteed.
There are a thousand ways to improve it (adx/bb based dynamic TP/SL, order lifecycle, pyramiding...) but it seems to be a cool starting point.
Don't forget to have fun!

Ichimoku Breakout Kumo SWING TRADER (By Insert Cheese)A simple strategy for long spot or long futures (swing traders) based on a basic method of Ichimoku Kinko Hyo strategies.
The strategy is simple:
- Buy when the price breaks the cloud
- Close the trade when the price closes again inside the cloud.
The parameters that work best on this strategy are 10,30,60,30 and 1 for Senkou-Span A
but you can try classic Ichimoku parameters (9,26,52,26,26) or whatever you want like (7,22,44,22,22), (10,30,60,30,30) and others.
-1D chart
I have removed everything from the interface except the cloud to make it visually more aesthetic :D (but if you want to see all the ichimoku indicator you can put in again into the chart)
I have also added several functions for you to do your own backtesting:
- Date range
- TP AND SL method
- Includes long or short trades
The strategy starts with 500 $ and use 100% for trade to make the power of the compounding :P
Remember that this is for only educational porpouse and you must to do your own research and backtested on your usually market..
I hope you like it enjoy and support this indicator :)
Donate (BEP20) 0xC118f1ffB3ac40875C13B3823C182eA2Af344c6d

LarryWillians - Simple StrategyA simple and classic strategy on market, created by LarryWillians using a EMA9.
The brute model use a Cross from closing price on EMA9. But occurs many false entries.
In other to correct this kind of thing, I add a SMA21 to confirm the trend and decrease numbers of false trades.
The strategy waits to break the last High (for buy) a position.
As a strategy requires a Risk Mannager, I created a simple way to trailing this, as well a Take Proft and Stop Loss in %.
Is not the best strategy but, is one of the most famous on financial markets. I did my adaptive version as simples as it is :)

Strategy Myth-Busting #8 - TrendSurfers+TrendOsc - [MYN]This is part of a new series we are calling "Strategy Myth-Busting" where we take open public manual trading strategies and automate them. The goal is to not only validate the authenticity of the claims but to provide an automated version for traders who wish to trade autonomously.
Our 8th one is an automated version of the " 653% Gain Magical 1 Minute Scalping Strategy Tested 100 Times | Become Consistently Huge Profit " strategy from " Fxaccurate US " who claims to have achieved 653% profit scalping GOLD on the 5 minute timeframe. As you can see from the backtest results below, I was unable to substantiate anything close to that that claim on any timeframe or symbol. Myth 10000% busted.
If you know of or have a strategy you want to see myth-busted or just have an idea for one, please feel free to message me.
This strategy uses a combination of 2 open-source public indicators:
Trend Surfers - Premium Breakout + Alerts by TrendSurfersSignals
Mawreez' Trend Oscillator Indicator by Mawreez
Trading Rules:
1 min - 15 min candles
Stop loss middle between high and low Risk 1:2
Long Condition
Trend Surfers Trailing stop line goes below (Crosses) lowest low
Bullish Candle (red)
Mawreeze Trend Oscilator Indicator is green
Short Condition
Trend Surfers Trailing stop line goes above (Crosses) highest high
Bearish Candle (red)
Mawreeze Trend Oscilator Indicator is red

Volatility Stop with Vwap StrategyFirst the credits goes to @TradingView for their release of the volatility stop mtf indicator.
I have took it, and inside I have added a weekly vwap for a better trend direction and at the same time I have added a dynamic risk managment which is calculated from the distance between the volatility line to the close of the candle.
The rules for entry are simple:
For long:We enter when our close of the candle is above the volatility stop line and at the same time the close of the candle is above weekly vwap
For short we enter when our close of the candle is below the volatility stop line and at the same time the close of the candle is below weekly vwap.
We exit when we either have a reverse signal than the one we enterred, or based on the TP/SL which is calculated with the distance from vwap to the close of the candle.
If you have any questions please let me know !

Supertrend - Long & Short -Sachin Ughadethis indicator for super trend strategy with buy and sell signals
Balance of Power Heikin Ashi Investing Strategy Balance of Power Heikin Ashi Investing Strategy
This is a swing strategy designed for investment help.
Its made around the Balace of Power indicator, but has been adapted on using the Monthly Heikin Ashi candle from the SPY asset in order to be used with correlation for US Stock/ETF/Index Markets.
The BOP acts as an oscilallator showing the power of a bull trend when its positive and a bearish trend when its in negative. At the same time we can spot reversals, based on the percentiles ( 99/1)
The rules for entry :
For long : The 99 percentile is ascending, and we are either in a positive value (>0), or we crossed the bottom place ( -0.35)
For short : the 99 and 1 percentile are descending, and we are either in a negative value(<0), or we crossed down the top place ( 0.6)
If you have any questions please let me know !

Coral Trend Pullback Strategy (TradeIQ)Description:
Strategy is taken from the TradeIQ YouTube video called "I Finally Found 80% Win Rate Trading Strategy For Crypto".
Check out the full video for further details/clarification on strategy entry/exit conditions.
The default settings are exactly as TradeIQ described in his video.
However I found some better results by some tweaking settings, increasing R:R ratio and by turning off confirmation indicators.
This would suggest that perhaps the current confirmation indicators are not the best options. I'm happy to try add some other optional confirmation indicators if they look to be more effective.
Recommended timeframe: 1H
Strategy incorporates the following features:
Risk management:
Configurable X% loss per stop loss
Configurable R:R ratio
Trade entry:
Based on strategy conditions below
Trade exit:
Based on strategy conditions below
Backtesting:
Configurable backtesting range by date
Trade drawings:
Each entry condition indicator can be turned on and off
TP/SL boxes drawn for all trades. Can be turned on and off
Trade exit information labels. Can be turned on and off
NOTE: Trade drawings will only be applicable when using overlay strategies
Alerting:
Alerts on LONG and SHORT trade entries
Debugging:
Includes section with useful debugging techniques
Strategy conditions
Trade entry:
LONG
C1: Coral Trend is bullish
C2: At least 1 candle where low is above Coral Trend since last cross above Coral Trend
C3: Pullback happens and price closes below Coral Trend
C4: Coral Trend colour remains bullish for duration of pullback
C5: After valid pullback, price then closes above Coral Trend
C6: Optional confirmation indicators (choose either C6.1 or C6.2 or NONE):
C6.1: ADX and DI (Single indicator)
C6.1.1: Green line is above red line
C6.1.2: Blue line > 20
C6.1.3: Blue trending up over last 1 candle
C6.2: Absolute Strengeh Histogram + HawkEye Volume Indicator (Two indicators combined)
C6.2.1: Absolute Strengeh Histogram colour is blue
C6.2.2: HawkEye Volume Indicator colour is green
SHORT
C1: Coral Trend is bearish
C2: At least 1 candle where high is below Coral Trend since last cross below Coral Trend
C3: Pullback happens and price closes above Coral Trend
C4: Coral Trend colour remains bearish for duration of pullback
C5: After valid pullback, price then closes below Coral Trend
C6: Optional confirmation indicators (choose either C6.1 or C6.2 or NONE):
C6.1: ADX and DI (Single indicator)
C6.1.1: Red line is above green line
C6.1.2: Blue line > 20
C6.1.3: Blue trending up over last 1 candle
C6.2: Absolute Strengeh Histogram + HawkEye Volume Indicator (Two indicators combined)
C6.2.1: Absolute Strengeh Histogram colour is red
C6.2.2: HawkEye Volume Indicator colour is red
NOTE: All the optional confirmation indicators cannot be overlayed with Coral Trend so feel free to add each separately to the chart for visual purposes
Trade exit:
Stop Loss: Calculated by recent swing low over previous X candles (configurable with "Local High/Low Lookback")
Take Profit: Calculated from R:R multiplier * Stop Loss size
Credits
Strategy origin: TradeIQ's YouTube video called "I Finally Found 80% Win Rate Trading Strategy For Crypto"
It combines the following indicators for trade entry conditions:
Coral Trend Indicator by @LazyBear (Main indicator)
Absolute Strength Histogram | jh by @jiehonglim (Optional confirmation indicator)
Indicator: HawkEye Volume Indicator by @LazyBear (Optional confirmation indicator)
ADX and DI by @BeikabuOyaji (Optional confirmation indicator)

SUPPORT RESISTANCE STRATEGY [5MIN TF]A SUPPORT RESISTANCE BREAKOUT STRATEGY for 5 minute Time-Frame , that has the time condition for Indian Markets
The Timing can be changed to fit other markets, scroll down to "TIME CONDITION" to know more.
The commission is also included in the strategy .
The basic idea is when ,
1) Price crosses above Resistance Level ,indicated by Red Line, is a Long condition.
2) Price crosses below Support Level ,indicated by Green Line , is a Short condition.
3) Candle high crosses above ema1, is a part of the Long condition .
4) Candle low crosses below ema1, is a part of the Short condition .
5) Volume Threshold is an added confirmation for long/short positions.
6) Maximum Risk per trade for the intraday trade can be changed .
7) Default qty size is set to 50 contracts , which can be changed under settings → properties → order size.
8) ATR is used for trailing after entry, as mentioned in the inputs below.
// ═════════════════════════//
// ————————> INPUTS <————————— //
// ═════════════════════════//
→ L_Bars ———————————> Length of Resistance / Support Levels.
→ R_Bars ———————————> Length of Resistance / Support Levels.
→ Volume Break ———————> Volume Breakout from range to confirm Long/Short position.
→ Price Cross Ema —————> Added condition as explained above (3) and (4).
→ ATR LONG —————————> ATR stoploss trail for Long positions.
→ ATR SHORT ————————> ATR stoploss trail for Short positions.
→ RISK ————————————> Maximum Risk per trade intraday.
The strategy was back-tested on TCS ,the input values and the results are mentioned under "BACKTEST RESULTS" below.
// ═════════════════════════ //
// ————————> PROPERTIES<——————— //
// ═════════════════════════ //
Default_qty_size ————> 50 contracts , which can be changed under
Settings
↓
Properties
↓
Order size
// ═══════════════════════════════//
// ————————> TIME CONDITION <————————— //
// ═══════════════════════════════//
The time can be changed in the script , Add it → click on ' { } ' → Pine editor→ making it a copy [right top corner} → Edit the line 27.
The Indian Markets open at 9:15am and closes at 3:30pm.
The 'time_cond' specifies the time at which Entries should happen .
"Close All" function closes all the trades at 3pm , at the open of the next candle.
To change the time to close all trades , Go to Pine Editor → Edit the line 92 .
All open trades get closed at 3pm , because some brokers don't allow you to place fresh intraday orders after 3pm .
// ═══════════════════════════════════════════════ //
// ————————> BACKTEST RESULTS ( 100 CLOSED TRADES )<————————— //
// ═══════════════════════════════════════════════ //
INPUTS can be changed for better Back-Test results.
The strategy applied to NSE:TCS ( 5 min Time-Frame and contract size 50) gives us 60% profitability , as shown below
It was tested for a period a 6 months with a Profit Factor of 1.8 ,net Profit of 30,000 Rs profit .
Sharpe Ratio : 0.49
Sortino Ratio : 1.4
The graph has a Linear Curve with Consistent Profits.
The INPUTS are as follows,
1) L_Bars —————————> 4
2) R_Bars —————————> 4
3) Volume Break ————> 5
4) Price Cross Ema ——> 100
5) ATR LONG ——————> 2.4
6) ATR SHORT —————> 2.6
7) RISK —————————> 2000
8) Default qty size ——> 50
NSE:TCS
Save it to favorites.
Apply it to your charts Now !!
Thank You ☺ NSE:TCS

Stock Gaps SPY Correlation StrategyThis is daytrade stock strategy, designed to take the best out of the daily gaps that are forming between the close of previous day and opening of present day.
At the same time its logic has been adapted for SPY chart, in order to use correlation with the other stocks/assets/ etf which are linked with SP500 movement.
Lastly it has been added 2 new confirmation logics, based on the USI: advance/decline chart and percentage above vwap among all US stocks.
The rules for entry are simple :
We are at the opening daily candle, we have a long/short gap based on where the opening is happening and at the same time we are checking to see that the current different between the current difference between low and previous high (or viceversa) is higher than an established parameter(minimal deviation )
For exit, we exit based on time/clock parameter, in this case by default I selected 1h and half before close of the US session.
For testing purposes I have used 10% of the available capital, with a 0.0035$ comission per each share bought ( IBKR comissions)
If there are any questions, please let me know either here or in private !

Pro Trading Art Open Range Breakout StrategyThis strategy is based on Selected Candle High Low Breakout with buffer point.
You can select specific candle from input tab by giving time of that candle.
Default Settings:
Start Hour : Hour of starting candle means from this input you can specify opening candle. Default is 9.
Start Minute: Minute of starting candle. Default is 15. Means Default opening candle is 9:15
Stop Hour : Means After this time no new trade will execute.
End Hour & End Minute & Close All Trade : Means when you specify End Hour and Minute and Close all trade is true then strategy will close all trade on specified time.
Buffer : With the help of this option you can add some point in High and low of Opening Candle
Trade Mode : You can specify Target and Stop Loss in point or Percent
Stop Loss Point or Percent : This will work according to Trade Mode
Target Point Or Percent : This will work according to Trade Mode

Accumulation Stage Identifier and Strategy around for TradingIn the psychology of trading at any market condition, there are four stage usually occurs on any tickers.
Stage 1 -> Neglect phase or consolidation phase
It occurs when the company does not produce the expected result and waiting for next result.
It can extend for days, weeks, months and years. Never give entry at this stage though that blue-chip told to be cheaper in price.
Stage 2 -> Accumulation
It occurs when the company's earning and sales consistently grows.
It can extend for days, weeks, months but should not expect the continues increase in price, as there will be potential pull-back which can be considered as opportunity to accumulate.
If the company fundamental is good, just give some space at the time of pullback.
Most of the time, the pullback volume will be low to compare to volume at the time of increase.
Usually, the stock that is going through accumulation stage will definitely trade above 200SMA and short term MA will be greater than long term moving average.
Continues the highest high and highest low along with volume.
Stage 3 -> Distribution
It occurs when the company's earning and sales stagnated due to certain reason.
It can extend for days, weeks while the price and volume highly volatile.
High volume while the price low
Typically, the stock that is going through distribution stage will certainly trade below 200SMA and short term MA will be lesser than long term moving average.
Continues the lowest high and lowest low along with volume.
Stage 4 -> Capitalization
Price reaches the 52W low while volume spikes on big down.
In each stage, the price & volume are perfect indicator to highlight the situation and the trader with proper discipline and patients can certainly reap the fruitful outcome of accumulation stage.
Based on this explanation, here is the strategy that is created with 50,90 & 200 Simple moving average and price volume trends (PVT) indicator applied on MACD to signal whenever the PVT convergence and divergence.
Note:
As the indicator designed to signal on the ticker that trade above 200 moving average, it is good to use this strategy on companies that are fundamental strong.
Whenever, there is pull back happens, the strategy might signal for exit, however, here comes the traders patient based on the conviction on the particular chosen stocks.
White being patient is good, disciplinary in following the strategy also important. Hence, consider the action when the stock goes opposite direction from your expectation.
Hope this strategy would help you find the profit.
Happy investing.

EMA + Bullish Engulfing Candle Pattern StrategyHello Guys! Nice to meet you all!
This is my first open source script!
### Long Condition
1. Bullish Engulfing Candle
2. No doge Candle
3. Present volume should be bigger than the previous volume (20%)
4. Trend filter (with 2 EMAs)
### Close Condition
1. When trend Changes
2. When Bearish Engulfing Candle appears
###
No stop loss and take profit.

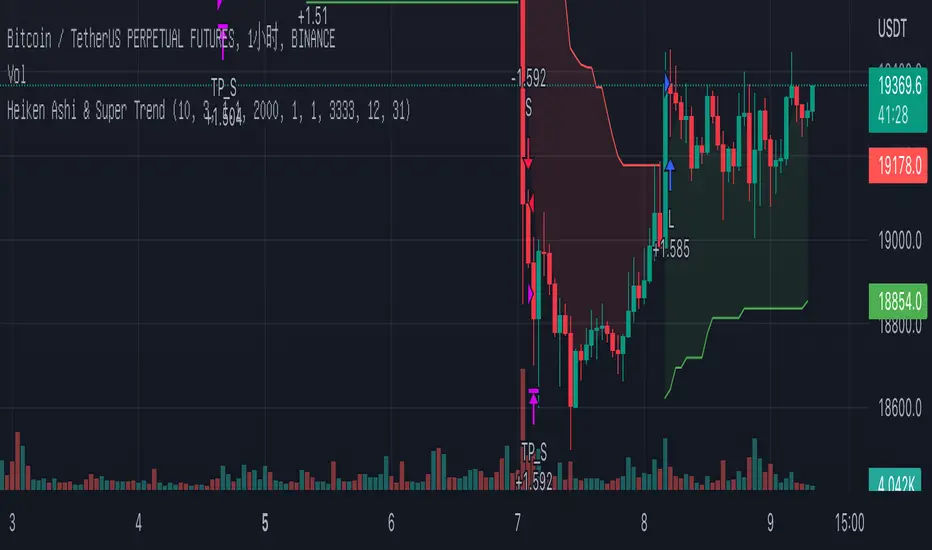
Heiken Ashi & Super TrendThis is one of my open source 1h strategies
It works on Binance: BTCUSDTPERP charts
This strategy involves two indicators
1. Heiken Ashi - a typical technical indicator to help highlight and clarify the current trend. This somehow allows the chart to ignore unnecessary fluctuations and make the trend more visible.
2.Super Trend - - One of the most common ATR-based indicators, the SuperTrend indicator is useful to help you catch big trends.
Buy entry conditions are as follows.
1. The Super Trend indicator running on the Heiken Ashi chart gives a buy signal.
2. Buy at the current market price and take profit at 1% of the normal k-line at this time.
Take profit
TP - 1%
Stop Loss
None