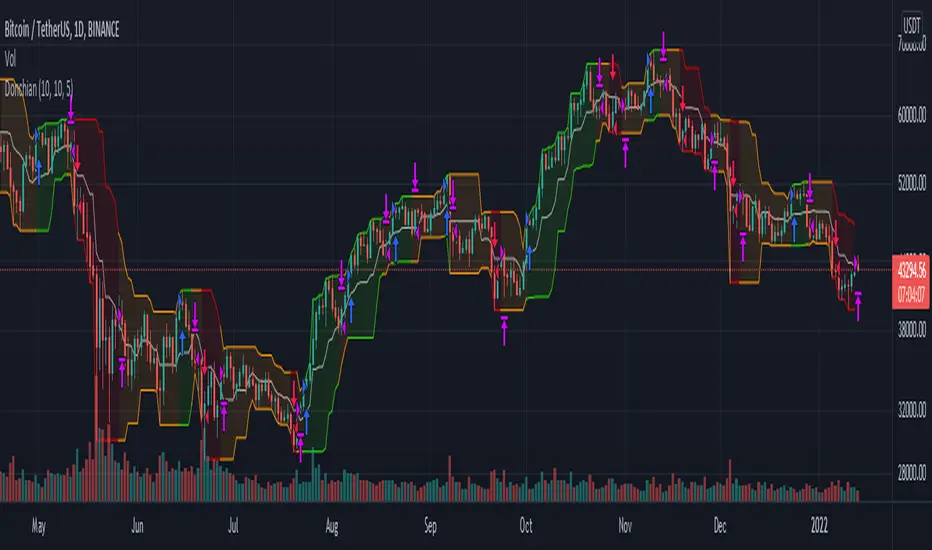
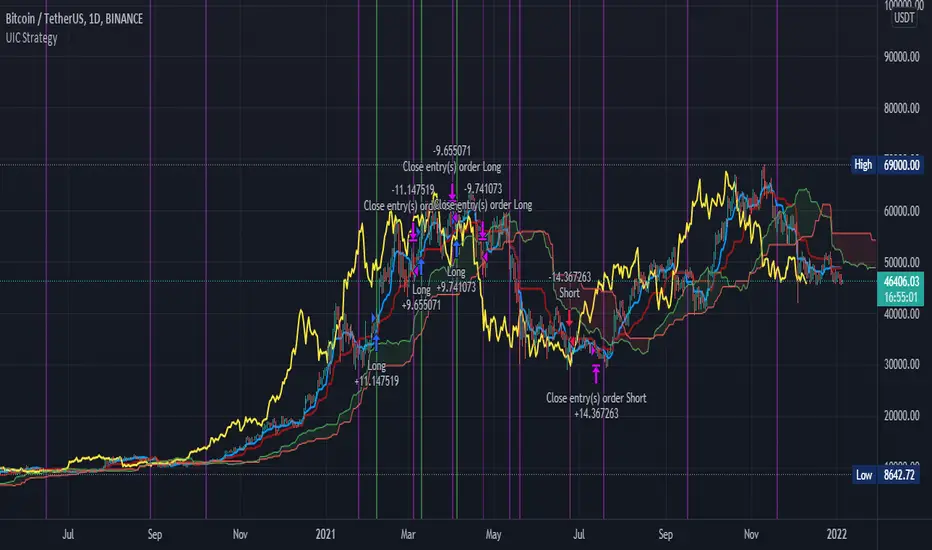
The Box Percent StratHi guys,
Version Zero (more work needed) of an idea I've been meaning to out into a strategy for a while. 🤯
This uses percent boxes🤔 instead of traditional indicators like RSI, MACD etc. 🤫
Takes the first close price of the series and creates a Top Band 10% up, buys if price reaches that level, and puts a stop on a Bot Band, 10% down
When the first trade is in profit by another 10%, it enters another trade and moves the stop of the first trade to breakeven ~ this way it only has one unit of risk at a time
/// Designed for LONG only on Daily, 2D or 3D Charts👌🏻
/// Uses fixed investment risk amount, meaning you're willing to lose that amount per trade
/// Limit buy to not overpay on entries
/// Idea Based on the Darvas system:
/// System only enters trades on strength, when prices equals of exceeds the green line
/// It ads onto the trades, but only *IF* the previous trade is in profit by the UpBoxSize percent size
/// The trailing stop loss is moved up, with the red line
/// A key idea is to only take one unit of risk at a time, meaning for a new add on trade to be taken, the previous trade should be in profit by the same box size as the new new trade's stop loss
/// This will keep adding trades again and again, and they will stop out at the same stop loss
/// Yellow Circles is an MA that filters out choppy areas -- this system only does really well on trending linear markets like: TQQQ, SSO, SPX, SPY
/// Base setting is 10% UpBox Size and 10% DnBox Size: 15% & 15% will be more accurate but fewer signals. 13% profit and 10% stop loss will give a higher risk to reward ratio
トレンド分析
Korea premium(KIMP)Korea premium(KIMP) Ver. 1.0
I posted an 'KIMP(Kimchi premium, Korea Premium) can be used as a leading indicator of collapse and adjustment.'
idea.
by the way @mahmodbeigy asked if it was true and I answered the question with this strategy.
Trend Surfers - Premium Breakout + AlertsTrend Surfers - Premium Breakout Strategy with Alerts
I am happy today to release the first free Trend Surfers complete Breakout Strategy!
The strategy includes:
Entry for Long and Short
Stoploss
Position Size
Exit Signal
Risk Management Feature
How the strategy works
This is a Trend Following strategy. The strategy will have drawdowns, but they will be way smaller than what you would go through with buy and old.
As a Trend Following strategy, we will buy on strength, when a breakout occurs. And sell on weakness.
The strategy includes a FIX Stoploss determined by an ATR multiple and a trailing Stoploss/Takeprofit also determined by an ATR multiple.
You can also manage your risk by entering the maximum % you are willing to risk on every trade. Additionally, there is an option to enter how many pairs you will be trading with the strategy. This will change your position size in order to make sure that you have enough funds to trade all your favorite pairs.
Use the strategy with alerts
This strategy is alert-ready. All you have to do is:
Go on a pair you would like to trade
Create an alert
Select the strategy as a Trigger
Wait for new orders to be sent to you
Every Entry (Long/Short) will include:
Market Entry (Enter position NOW!)
Stoploss price
Position Size
Leverage
* If you do not wish to use leverage, you can multiply the Position Size by the Leverage. But doing that, you might end up with a position greater than your equity. Trading on Futures is better in order to have accurate risk management.
Exit signals:
When you receive an exit signal, you need to close the position ASAP. If you want to keep your results as close as possible to the backtest results, you need to execute quickly and follow what the strategy is telling you.
Do not try to outsmart the strategy
Leave your emotion out of trading! If you trust the strategy, you will have way better returns than if you try to outsmart it. Follow each signal you receive even if it doesn't seem logical at the moment.
Become a machine that executes. Don't look at fundamentals. Follow the trend! Trust the strategy!
I hope you enjoy it!
Buying Dip Strategy With Take Profit And Stop Loss [racer8]"Buy low, sell high."
This system buys the dip and takes profit for a high win rate.
It uses an ATR take profit and ATR stop loss.
It buys the dip when the close is below the previous 7 day low.
Daily timeframe is best.
Enjoy ♡
ELIA MULTI INDICATORS STRATEGYExperimental multi indicators strategy, to catch right entry and avoid noise.
Each indicator included in the strategy, assume a value based on its status and because is a trend-follow strategy, some indicator value are higher then the other
Backtested on ETHUSDTPERP
BINANCE:ETHUSDTPERP
Scalping Dips On Trend (by Coinrule)Coinrule's Community is an excellent source of inspiration for our trading strategies.
In these months of Bull Market, our traders opted mostly on buy-the-dips strategies, which resulted in great returns recently. But there has been an element that turned out to be the cause for deep division among the Community.
Is it advisable or not to use a stop-loss during a Bull Market?
This strategy comes with a large stop-loss to offer a safer alternative for those that are not used to trade with a downside protection.
Entry
The strategy buys only when the price is above the Moving Average 50 , making it less risky to buy the dip, which is set to 2%.
The preferred time frame is 1-hour.
The stop-loss is set to be quite loose to increase the chances of closing the trade in profit, yet protecting from unexpected larger drawdowns that could undermine the allocation's liquidity.
Exit
Stop loss: 10%
Take Profit: 3%
In times of Bull Market, such a trading system has a very high percentage of trades closed in profit (ranging between 70% to 80%), which makes it still overall profitable to have a stop-loss three times larger than the take profit.
Pro tip: use a larger stop-loss only when you expect to close in profit most of the trades!
The strategy assumes each order to trade 30% of the available capital and opens a trade at a time. A trading fee of 0.1% is taken into account.
(IK) Stoch-60-15This strategy uses 60 minute and 15 minute stochastic data to determine entry and exit; it only executes long trades. I've only used this on BTC/USD, but I imagine the concepts employed should hold for any ticker
The script builds a simple Stochastic indicator for the current timeframe, and it also plots a single stochastic line for a higher resolution time frame. I've found good results trading on 15 minutes with a 60 minute higher resolution.
We enter a trade if the higher resolution stochastic is in an uptrend, if the current resolution stochastic is in an uptrend, and if the current stochastic value is less than 50.
We exit a trade when the current stochastic value crosses below 80 or the trailing stop loss is hit.
Stop loss is calculated with the input value, Stop Loss Percent. This value represents the percent of capital you're willing to lose before exiting a trade. A stop loss percent of 0.050 means your trade will exit if it falls 5% from the highest high since entering a trade. You will have at least 95% of your original capital left. There is no option to change a trailing stop loss to a set stop loss (in order to keep the code as simple as possible), however, you can turn it off by setting Stop Loss Percent to 1.
I tried to keep the script itself lightweight and very easy to understand, so it's not very customizable in regards to input options. You can change stochastic data, as well as the trailing stop percentage. The script can be adjusted to other timeframes, however this requires a small change in the code (details in script comments). Changing just the "Higher Resolution" input will not produce expected results
My hope is that by keeping it lightweight and simple, it will be easier for you to adjust to your specific needs, or work into a larger strategy.
Combo Backtest 123 Percent change bar This is combo strategies for get a cumulative signal.
First strategy
This System was created from the Book "How I Tripled My Money In The
Futures Market" by Ulf Jensen, Page 183. This is reverse type of strategies.
The strategy buys at market, if close price is higher than the previous close
during 2 days and the meaning of 9-days Stochastic Slow Oscillator is lower than 50.
The strategy sells at market, if close price is lower than the previous close price
during 2 days and the meaning of 9-days Stochastic Fast Oscillator is higher than 50.
Second strategy
This histogram displays price or % change from previous bar.
WARNING:
- For purpose educate only
- This script to change bars colors.
Combo Backtest 123 Overbought/Oversold This is combo strategies for get a cumulative signal.
First strategy
This System was created from the Book "How I Tripled My Money In The
Futures Market" by Ulf Jensen, Page 183. This is reverse type of strategies.
The strategy buys at market, if close price is higher than the previous close
during 2 days and the meaning of 9-days Stochastic Slow Oscillator is lower than 50.
The strategy sells at market, if close price is lower than the previous close price
during 2 days and the meaning of 9-days Stochastic Fast Oscillator is higher than 50.
Second strategy
Simple Overbought/Oversold indicator
WARNING:
- For purpose educate only
- This script to change bars colors.
Strategy NNFX Tester Strategy NNFX, Baseline, QQEs Fast C1, Slow C2, ATR, Volume and Exit
This is a Strategy Tester designed to work with Study (Alerts) of the same.
At time of creation based on Revision 8 of the Study.
DO NOT USE the Currency/Money Management section under settings. use the position sizing under "Inputs" - "Money Management" - "Risk per trade" which is defaulted to 2%
This has adjustable Baselines, Exits, ATR calculations, C1 and C2 are currently QQE & QQE Histo with adjustable settings but I'll include more choice of C1 & C2 as time goes on.
Find settings that work for you, then move them over to the Study version for best results.
Forward plans are to add much more options to both Alert/Strategy.
If anyone wants to collaborate or anything hit me up.
TemaI have found that such simple crossover can show good results. Basically it has only 2 TEMA and nothing more. I don't know what else to write here. The code is simplest and has only one filter, which take into consideration the direction of chart.
Combo Backtest 123 Reversal & N Bars Up This is combo strategies for get a cumulative signal.
First strategy
This System was created from the Book "How I Tripled My Money In The
Futures Market" by Ulf Jensen, Page 183. This is reverse type of strategies.
The strategy buys at market, if close price is higher than the previous close
during 2 days and the meaning of 9-days Stochastic Slow Oscillator is lower than 50.
The strategy sells at market, if close price is lower than the previous close price
during 2 days and the meaning of 9-days Stochastic Fast Oscillator is higher than 50.
Second strategy
Evaluates for n number of consecutive higher closes. Returns a value
of 1 when the condition is true or 0 when false.
WARNING:
- For purpose educate only
- This script to change bars colors.
Combo Backtest 123 Reversal & N Bars Down This is combo strategies for get a cumulative signal.
First strategy
This System was created from the Book "How I Tripled My Money In The
Futures Market" by Ulf Jensen, Page 183. This is reverse type of strategies.
The strategy buys at market, if close price is higher than the previous close
during 2 days and the meaning of 9-days Stochastic Slow Oscillator is lower than 50.
The strategy sells at market, if close price is lower than the previous close price
during 2 days and the meaning of 9-days Stochastic Fast Oscillator is higher than 50.
Second strategy
Evaluates for n number of consecutive lower closes. Returns a value
of 1 when the condition is true or 0 when false.
WARNING:
- For purpose educate only
- This script to change bars colors.
At Specified Time, Execute OrderSell current holdings at a specified time, then place a buy limit order at 1% the selling price.
Three moving average strategies
If the short term (Default 7) moving average cuts the medium term (default 25) moving average, BUY. Conversely, it generates the SELL signal. If the long term (Default 99) moving average cuts its short term moving average, Quick SELL. Conversely, it can be interpreted as Fast SELL. You can change the moving average and the number of days as you wish, and you can trade in the short or long term. I hope it was useful.
Momentum Strategy (BTC/USDT; 1h) - MACD (with source code)Good morning traders.
It's been a while from my last publication of a strategy and today I want to share with you this small piece of script that showed quite interesting result across bitcoin and other altcoins.
The macd indicator is an indicator built on the difference between a fast moving average and a slow moving average: this difference is generally plottted with a blue line while the orange line is simply a moving average computed on this difference.
Usually this indicator is used in technical analysis for getting signals of buy and sell respectively when the macd crosses above or under its moving average: it means that the distance of the fast moving average (the most responsive one) from the slower one is getting lower than what it-used-to-be in the period considered: this could anticipate a cross of the two moving averages and you want to anticipate this potential trend reversal by opening a long position
Of course the workflow is specularly the same for opening short positions (or closing long positions)
What this strategy does is simply considering the moving average computed on macd and applying a linear regression on it: in this way, even though the signal can be sligthly delayed, you reduce noise plotting a smooth curve.
Then, it simply checks the maximums and the minimums of this curve detecting whenever the changes of the values start to be negative or positive, so it opens a short position (closes long) on the maximum on this curve and it opens a long position (closes short) on the minimum.
Of course, I set an option for using this strategy in a conventional way working on the crosses between macd and its moving average. Alternatively you can use this workflow if you prefer.
In conclusion, you can use a tons of moving averages: I made a function in pine in order to allw you to use any moving average you want for the two moving averages on which the macd is based or for the moving average computed on the macd
PLEASE, BE AWARE THAT THIS TRADING STRATEGY DOES NOT GUARANTEE ANY KIND OF SUCCESS IN ADVANCE. YOU ARE THE ONE AND ONLY RESPONSIBLE OF YOUR OWN DECISIONS, I DON'T TAKE ANY RESPONSIBILITY ASSOCIATED WITH THEM. IF YOU RUN THIS STRATEGY YOU ACCEPT THE POSSIBILITY OF LOOSING MONEY, ALL OF MY PUBBLICATIONS ARE SUPPOSED TO BE JUST FOR EDUCATIONAL PURPOSES.
IT IS AT YOUR OWN RISK WHETHER TO USE IT OR NOT
But if you make money out of this, please consider to buy me a beer 😜
Happy Trading!
Heikin-Ashi MACD"Heikin-Ashi, also sometimes spelled Heiken-Ashi, means "average bar" in Japanese. The Heikin-Ashi technique can be used in conjunction with candlestick charts when trading securities to spot market trends and predict future prices. It's useful for making candlestick charts more readable and trends easier to analyze. For example, traders can use Heikin-Ashi charts to know when to stay in trades while a trend persists but get out when the trend pauses or reverses. Most profits are generated when markets are trending, so predicting trends correctly is necessary."
HA bars help us to smooth the price action, and I think MACD gives me a lot of signals and I need to eliminate them and add MACD strategy on Heiken-Ashi candles to look performance.
Mostly, it eliminates %75 of the signals, and most of the time it did increase backtest performance significantly.
There is still a way to it to combine other indicators for complete strategy, but at least We can achieve better MACD with this approach.
2Tier Ichimoku Pyramiding [Takazudo]Ichimoku based pyramiding strategy example that was tested on 4h TF.
makes the first entry when 2Tier Kumo breakout was occurred.
makes the extra entries when higher-low (on long) or lower-high (on short) was occurred.
uses short term MACD reversal + stop entry as a confirmation of the trend.
slack trailing stop loss.
changes entry quantity by the percentage of SL.
prevents the ranged entry.
This is just an example of how to trade using Ichimoku signals.
SNAP BACK 2.0 Strategy
This strategy is designed to allow you to catch the bounce or "SNAP Back" of an equity that has been in a trend.
1) Once the moving averages are in the order of 200SMA > 50 SMA > 34EMA > 20SMA > 8EMA (or reverse for and uptrend), the strategy is setup.
2) Next you wait for a trigger of the closing price crossing the 8EMA, while there is a desired gap size between the 8EMA and the 20SMA (2-10% of stock value preferred).
3) Exit position based on target profit reached (conservative sell half at 34EMA and engage a trailing stop loss for remainder or set static limit) or price crosses 8EMA or stop loss%
*)This code also allows you to determine your desired backtesting date compliments of alanaster
This code is the product of many hours of hard work on the part of the greater tradingview community. The credit goes to everyone in the community who has put code out there for the greater good.
The idea for the coding came from a video I watched on YouTube presented by TradeStation called Snap Back - thank you guys for the inspiration.
UPDATE: I have coded the other side of the strategy to allow you to take advantage of the same set-up in an uptrend for Short plays. You can turn the up or downsides on, off, or both.
The main intent is to catch the bounces of a falling stock. However, I have found that you can do the inverse and catch the drops in a rising stock (the latter is not as reliable). This also tends to work better on less volatile stocks. I have included a large volume of user defined conditions and display entry and exit conditions on the chart to see how your choices are impacting the script.
Basic SMA 200 StrategyThe SMA 200 basic strategy will be more than familiar to most traders.
This strategy is to stay with the programming language so to say the "Hello World" of trading.
The SMA 200 basic strategy is also one of the simplest strategies in trading. All that is required is the price and a 200 period moving average. Usually the strategy is used in the daily chart.
The rules are as follows:
Entry: A position is opened when the price crosses the moving average 200 from the bottom to the top.
Exit: The position is closed when the price crosses the moving average from top to bottom.
This is a trend following system and was originally used for trading stocks.
In my opinion, trading with the strategy is recommended to every beginner. There are strategies with better performance, but they are much more complicated to implement. And that's where the big advantage of the strategy can be seen.
Beginners are more than overwhelmed at the beginning of their trading career. Often beginners trade in the 5 min chart with 6 different indicators some signals that they have seen in a Youtube video.
Comparable to a beginner driver who immediately gets into a Porsche as his first car.
Beginners should follow simple rules and avoid intraday charts. Above all, you should do the actual work of a trader.A trader does not just press the mouse twenty times a day and then has easily earned 2000 $. A trader tests systems down to the smallest detail, optimizes and tests again, until he has found an almost " waterproof " trading system. The 200 SMA basic strategy is excellent for gaining experience, learning to follow the rules of a system and not to burn your money right away.
With this script you can test how successful the "simplest strategy in the world" would have been in the past.
Small tip: Do not trade Forex with it it will never work. The strategy is made for long trends and you can find them for example in the stock market.
Have fun with it! About a positive feedback I would be very happy of course.
PROSTRATS Pine Script for Swing TradingThis is a simple script for swing trading. It uses my 2 favorite indicators; the Choppiness Index as well as Fibonacci Retracement. This script is meant to run on the 4 hour time frame, in my case I use BTCUSD. It will buy when 2 conditions are met. The first is that the Choppiness Index is above 54.5 on the Daily Time frame, which means the price has potential to swing high or low. I used the security() function to ensure this takes place on the daily time frame because larger time frames tend to dominate smaller time frames in terms of overall swings. The second condition is that the price has to cross above the 1 level of the Fibonacci Retracement. This ensures that the swing is going to be an upwards swing, as opposed to a downwards one. The measure I took to ensure that the Fibonacci Retracement level of 1 is above the 0 level is to make sure that the r value of the 1 level is greater than the r value of the 0 level.
The sell condition is programmed to execute when either the price crosses above the 1.618 level(profit target) or cross below the 0 level(stop loss).