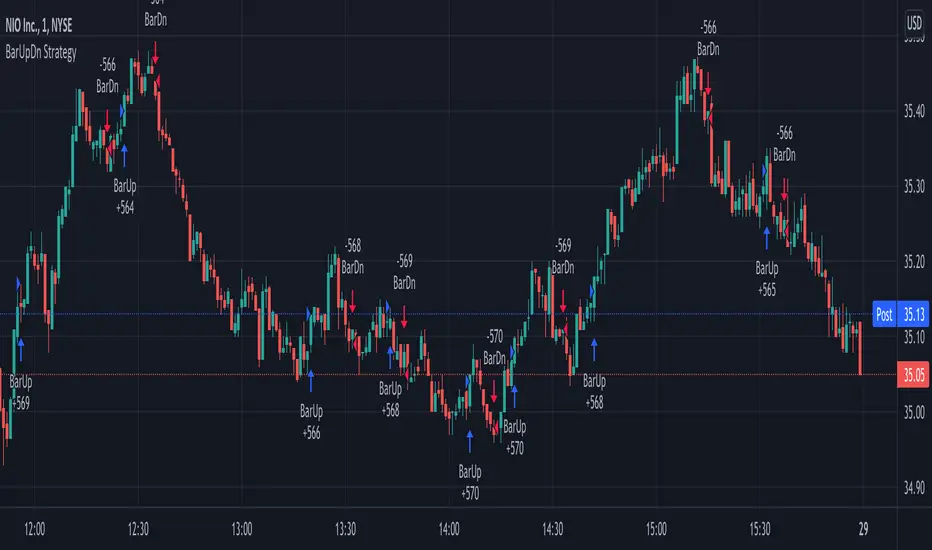
BBofVWAP with entry at Pivot PointThis strategy uses BB of VWAP and Pivot point to enter and exit the Long position.
settings
BB length 50
BB Source VWAP
Entry
When VWAP crossing up BB midline and price/close is above weekly PivotPoint ( you can also use Daily pivot point )
Exit
When VWAP is crossing down BB lower band
Stop Loss
Stop loss defaulted to 5%
Note : Long will position will be exited on either VWAP crossing down BB lower band or stop loss is hit - whichever comes first . Being said that some time your stop loss exit is less than 5% which saves from more losses.
Entry is based on weekly Pivot point , so any time frame below weekly will work perfect. I have tested t on 30 min , 1 HR , 4 Hr , Daily charts. Even weekly setting shows good results , that will work for long term investing style.
if you change Pivot period to Daily , chose time frames below Daily.
I also noticed this strategy mostly do not enter Long position in a down trend. Even it finds one , it will be exited with minimal loss.
Warning
For the use of educational purposes only
トレンド分析
Combo Backtest 123 Reversal & Ichimoku2c This is combo strategies for get a cumulative signal.
First strategy
This System was created from the Book "How I Tripled My Money In The
Futures Market" by Ulf Jensen, Page 183. This is reverse type of strategies.
The strategy buys at market, if close price is higher than the previous close
during 2 days and the meaning of 9-days Stochastic Slow Oscillator is lower than 50.
The strategy sells at market, if close price is lower than the previous close price
during 2 days and the meaning of 9-days Stochastic Fast Oscillator is higher than 50.
Second strategy
Ichimoku Strategy
WARNING:
- For purpose educate only
- This script to change bars colors.
Joseph Nemeth Heiken Ashi Renko MTF StrategyFor Educational Purposes. Results can differ on different markets and can fail at any time. Profit is not guaranteed. This only works in a few markets and in certain situations. Changing the settings can give better or worse results for other markets.
Nemeth is a forex trader that came up with a multi-time frame heiken ashi based strategy that he showed to an older audience crowd on a speaking event video. He seems to boast about his strategy having high success results and makes an astonishing claim that looking at heiken ashi bars instead of regular candlestick bar charts can show the direction of the trend better and simpler than many other slower non-price based indicators. He says pretty much every indicator is about the same and the most important indicator is price itself. He is pessimistic about the markets and seems to think it is rigged and there is a sort of cabal that created rules to favor themselves, such as the inability of traders to hedge in one broker account, and that to win you have to take advantage of the statistics involved in the game. He believes fundamentals, chart patterns such as cup and handle and head and shoulders, and fibonacci numbers don't matter, only price matters. The foundation of his trading strategy is based around heiken ashi bars because they show a statistical pattern that can supposedly be taken advantage of by them repeating around seventy or so percent of the time, and then combines this idea with others based on the lower time frames involved.
The first step he uses is to identify the trend direction in the higher time frame(daily or 4 hourly) using the color of the heiken ashi bar itself. If it is green then take only long position after the bar completes, if it is red then take only short position. Next, on a lower time frame(1 hour or 30 minutes) look for the slope of the 20 exponential moving average to be sloping upward if going long or the slope of the ema to be sloping downward if going short(the price being above the moving average can work too if it's too hard to visualize the slope). Then look for the last heiken ashi bar, similarly to the first step, if it is green take long position, if it is red take short position. Finally the entry indicator itself will decide the entry on the lowest time frame. Nemeth recommends using MACD or CCI or possibly combine the two indicators on a 5 min or 15 min or so time frame if one does not have access to renko or range bars. If renko bars are available, then he recommends a 5 or 10 tick bar for the size(although I'm not sure if it's really possible to remove the time frame from renko bars or if 5 or 10 ticks is universal enough for everything). The idea is that renko bars paint a bar when there is price movement and it's important to have movement in the market, plus it's a simple indicator to use visually. The exit strategy is when the renko or the lowest time frame indicator used gives off an exit signal or if the above conditions of the higher time frames are not being met(he was a bit vague on this). Enter trades with only one-fifth of your capital because the other fifths will be used in case the trades go against you by applying a hedging technique he calls "zero zone recovery". He is somewhat vague about the full workings(perhaps because he uses his own software to automate his strategy) but the idea is that the second fifth will be used to hedge a trade that isn't going well after following the above, and the other fifths will be used to enter on another entry condition or if the other hedges fail also. Supposedly this helps the trader always come out with a profit in a sort of bushido-like trading tactic of never accepting defeat. Some critics argue that this is simply a ploy by software automation to boost their trade wins or to sell their product. The other argument against this strategy is that trading while the heiken ashi bar has not completed yet can jack up the backtest results, but when it comes to trading in real time, the strategy can end up repainting, so who knows if Nemeth isn't involving repainting or not, however he does mention the trades are upon completion of the bar(it came from an audience member's question). Lastly, the 3 time frames in ascending or descending fashion seem to be spaced out by about factors of 4 if you want to trade other time frames other than 5/15min,30min/1hour, or 4hour/daily(he mentioned the higher time frame should be atleast a dozen times higher than the lower time frame).
Personally I have not had luck getting the seventy+ percent accuracy that he talks about, whether in forex or other things. I made the default on renko bars to an ATR size 1 setting because it looks like the most universal option if the traditional mode box size is too hard to guess, and I made it so that you can switch between ATR and Traditional mode just in case. I don't think the strategy repaints because I think TV set a default on the multi-time frame aspects of their code to not re-paint, but I could be wrong so you might want to watch out for that. The zero zone recovery technique is included in the code but I commented it out and/or remove it because TV does not let you apply hedging properly, as far as I know. If you do use a proper hedging strategy with this, you'll find a very interesting bushido type of trading style involved with the Japanese bars that can boost profits and win rates of around possibly atleast seventy percent on every trade but unfortunately I was not able to test this part out properly because of the limitation on hedging here, and who knows if the hedging part isn't just a plot to sell his product. If his strategy does involve the repainting feature of the heiken ashi bars then it's possible he might have been preaching fools-gold but it's hard to say because he did mention it is upon completion of the bars. If you find out if this strategy works or doesn't work or find out a good setting that I somehow didn't catch, please feel free to let me know, will gladly appreciate it. We are all here to make some money!
Combo Backtest 123 Reversal & High and Low Levels This is combo strategies for get a cumulative signal.
First strategy
This System was created from the Book "How I Tripled My Money In The
Futures Market" by Ulf Jensen, Page 183. This is reverse type of strategies.
The strategy buys at market, if close price is higher than the previous close
during 2 days and the meaning of 9-days Stochastic Slow Oscillator is lower than 50.
The strategy sells at market, if close price is lower than the previous close price
during 2 days and the meaning of 9-days Stochastic Fast Oscillator is higher than 50.
Second strategy
This script shows a high and low period value.
Width - width of lines
SelectPeriod - Day or Week or Month and etc.
LookBack - Shift levels 0 - current period, 1 - previous and etc.
WARNING:
- For purpose educate only
- This script to change bars colors.
Guerilla Fear/Greed Index StrategyThis strategy combines NAAIM Exposure Index and the Equity Put/Call Ratio into Fear/Greed Index that oscillates between 0 and 100.
It smooths all of these values and enters a trade when Fear reaches a certain threshold and exits when Greed reaches a certain threshold.
I don't really know if this is a great indicator or not, but the results on various indexes are pretty good, especially NASDAQ:TQQQ .
Was inspired by the knowledge gained following RolandoSantos .
888 BOT #backtest█ 888 BOT #backtest (open source)
This is an Expert Advisor 'EA' or Automated trading script for ‘longs’ and ‘shorts’, which uses only a Take Profit or, in the worst case, a Stop Loss to close the trade.
It's a much improved version of the previous ‘Repanocha’. It doesn`t use 'Trailing Stop' or 'security()' functions (although using a security function doesn`t mean that the script repaints) and all signals are confirmed, therefore the script doesn`t repaint in alert mode and is accurate in backtest mode.
Apart from the previous indicators, some more and other functions have been added for Stop-Loss, re-entry and leverage.
It uses 8 indicators, (many of you already know what they are, but in case there is someone new), these are the following:
1. Jurik Moving Average
It's a moving average created by Mark Jurik for professionals which eliminates the 'lag' or delay of the signal. It's better than other moving averages like EMA , DEMA , AMA or T3.
There are two ways to decrease noise using JMA . Increasing the 'LENGTH' parameter will cause JMA to move more slowly and therefore reduce noise at the expense of adding 'lag'
The 'JMA LENGTH', 'PHASE' and 'POWER' parameters offer a way to select the optimal balance between 'lag' and over boost.
Green: Bullish , Red: Bearish .
2. Range filter
Created by Donovan Wall, its function is to filter or eliminate noise and to better determine the price trend in the short term.
First, a uniform average price range 'SAMPLING PERIOD' is calculated for the filter base and multiplied by a specific quantity 'RANGE MULTIPLIER'.
The filter is then calculated by adjusting price movements that do not exceed the specified range.
Finally, the target ranges are plotted to show the prices that will trigger the filter movement.
Green: Bullish , Red: Bearish .
3. Average Directional Index ( ADX Classic) and ( ADX Masanakamura)
It's an indicator designed by Welles Wilder to measure the strength and direction of the market trend. The price movement is strong when the ADX has a positive slope and is above a certain minimum level 'ADX THRESHOLD' and for a given period 'ADX LENGTH'.
The green color of the bars indicates that the trend is bullish and that the ADX is above the level established by the threshold.
The red color of the bars indicates that the trend is down and that the ADX is above the threshold level.
The orange color of the bars indicates that the price is not strong and will surely lateralize.
You can choose between the classic option and the one created by a certain 'Masanakamura'. The main difference between the two is that in the first it uses RMA () and in the second SMA () in its calculation.
4. Parabolic SAR
This indicator, also created by Welles Wilder, places points that help define a trend. The Parabolic SAR can follow the price above or below, the peculiarity that it offers is that when the price touches the indicator, it jumps to the other side of the price (if the Parabolic SAR was below the price it jumps up and vice versa) to a distance predetermined by the indicator. At this time the indicator continues to follow the price, reducing the distance with each candle until it is finally touched again by the price and the process starts again. This procedure explains the name of the indicator: the Parabolic SAR follows the price generating a characteristic parabolic shape, when the price touches it, stops and turns ( SAR is the acronym for 'stop and reverse'), giving rise to a new cycle. When the points are below the price, the trend is up, while the points above the price indicate a downward trend.
5. RSI with Volume
This indicator was created by LazyBear from the popular RSI .
The RSI is an oscillator-type indicator used in technical analysis and also created by Welles Wilder that shows the strength of the price by comparing individual movements up or down in successive closing prices.
LazyBear added a volume parameter that makes it more accurate to the market movement.
A good way to use RSI is by considering the 50 'RSI CENTER LINE' centerline. When the oscillator is above, the trend is bullish and when it is below, the trend is bearish .
6. Moving Average Convergence Divergence ( MACD ) and ( MAC-Z )
It was created by Gerald Appel. Subsequently, the histogram was added to anticipate the crossing of MA. Broadly speaking, we can say that the MACD is an oscillator consisting of two moving averages that rotate around the zero line. The MACD line is the difference between a short moving average 'MACD FAST MA LENGTH' and a long moving average 'MACD SLOW MA LENGTH'. It's an indicator that allows us to have a reference on the trend of the asset on which it is operating, thus generating market entry and exit signals.
We can talk about a bull market when the MACD histogram is above the zero line, along with the signal line, while we are talking about a bear market when the MACD histogram is below the zero line.
There is the option of using the MAC-Z indicator created by LazyBear, which according to its author is more effective, by using the parameter VWAP ( volume weighted average price ) 'Z-VWAP LENGTH' together with a standard deviation 'STDEV LENGTH' in its calculation.
7. Volume Condition
Volume indicates the number of participants in this war between bulls and bears, the more volume the more likely the price will move in favor of the trend. A low trading volume indicates a lower number of participants and interest in the instrument in question. Low volumes may reveal weakness behind a price movement.
With this condition, those signals whose volume is less than the volume SMA for a period 'SMA VOLUME LENGTH' multiplied by a factor 'VOLUME FACTOR' are filtered. In addition, it determines the leverage used, the more volume , the more participants, the more probability that the price will move in our favor, that is, we can use more leverage. The leverage in this script is determined by how many times the volume is above the SMA line.
The maximum leverage is 8.
8. Bollinger Bands
This indicator was created by John Bollinger and consists of three bands that are drawn superimposed on the price evolution graph.
The central band is a moving average, normally a simple moving average calculated with 20 periods is used. ('BB LENGTH' Number of periods of the moving average)
The upper band is calculated by adding the value of the simple moving average X times the standard deviation of the moving average. ('BB MULTIPLIER' Number of times the standard deviation of the moving average)
The lower band is calculated by subtracting the simple moving average X times the standard deviation of the moving average.
the band between the upper and lower bands contains, statistically, almost 90% of the possible price variations, which means that any movement of the price outside the bands has special relevance.
In practical terms, Bollinger bands behave as if they were an elastic band so that, if the price touches them, it has a high probability of bouncing.
Sometimes, after the entry order is filled, the price is returned to the opposite side. If price touch the Bollinger band in the same previous conditions, another order is filled in the same direction of the position to improve the average entry price, (% MINIMUM BETTER PRICE ': Minimum price for the re-entry to be executed and that is better than the price of the previous position in a given %) in this way we give the trade a chance that the Take Profit is executed before. The downside is that the position is doubled in size. 'ACTIVATE DIVIDE TP': Divide the size of the TP in half. More probability of the trade closing but less profit.
█ STOP LOSS and RISK MANAGEMENT.
A good risk management is what can make your equity go up or be liquidated.
The % risk is the percentage of our capital that we are willing to lose by operation. This is recommended to be between 1-5%.
% Risk: (% Stop Loss x % Equity per trade x Leverage) / 100
First the strategy is calculated with Stop Loss, then the risk per operation is determined and from there, the amount per operation is calculated and not vice versa.
In this script you can use a normal Stop Loss or one according to the ATR. Also activate the option to trigger it earlier if the risk percentage is reached. '% RISK ALLOWED'
'STOP LOSS CONFIRMED': The Stop Loss is only activated if the closing of the previous bar is in the loss limit condition. It's useful to prevent the SL from triggering when they do a ‘pump’ to sweep Stops and then return the price to the previous state.
█ BACKTEST
The objective of the Backtest is to evaluate the effectiveness of our strategy. A good Backtest is determined by some parameters such as:
- RECOVERY FACTOR: It consists of dividing the 'net profit' by the 'drawdown’. An excellent trading system has a recovery factor of 10 or more; that is, it generates 10 times more net profit than drawdown.
- PROFIT FACTOR: The ‘Profit Factor’ is another popular measure of system performance. It's as simple as dividing what win trades earn by what loser trades lose. If the strategy is profitable then by definition the 'Profit Factor' is going to be greater than 1. Strategies that are not profitable produce profit factors less than one. A good system has a profit factor of 2 or more. The good thing about the ‘Profit Factor’ is that it tells us what we are going to earn for each dollar we lose. A profit factor of 2.5 tells us that for every dollar we lose operating we will earn 2.5.
- SHARPE: (Return system - Return without risk) / Deviation of returns.
When the variations of gains and losses are very high, the deviation is very high and that leads to a very poor ‘Sharpe’ ratio. If the operations are very close to the average (little deviation) the result is a fairly high 'Sharpe' ratio. If a strategy has a 'Sharpe' ratio greater than 1 it is a good strategy. If it has a 'Sharpe' ratio greater than 2, it is excellent. If it has a ‘Sharpe’ ratio less than 1 then we don't know if it is good or bad, we have to look at other parameters.
- MATHEMATICAL EXPECTATION: (% winning trades X average profit) + (% losing trades X average loss).
To earn money with a Trading system, it is not necessary to win all the operations, what is really important is the final result of the operation. A Trading system has to have positive mathematical expectation as is the case with this script: ME = (0.87 x 30.74$) - (0.13 x 56.16$) = (26.74 - 7.30) = 19.44$ > 0
The game of roulette, for example, has negative mathematical expectation for the player, it can have positive winning streaks, but in the long term, if you continue playing you will end up losing, and casinos know this very well.
PARAMETERS
'BACKTEST DAYS': Number of days back of historical data for the calculation of the Backtest.
'ENTRY TYPE': For '% EQUITY' if you have $ 10,000 of capital and select 7.5%, for example, your entry would be $ 750 without leverage. If you select CONTRACTS for the 'BTCUSDT' pair, for example, it would be the amount in 'Bitcoins' and if you select 'CASH' it would be the amount in $ dollars.
'QUANTITY (LEVERAGE 1X)': The amount for an entry with X1 leverage according to the previous section.
'MAXIMUM LEVERAGE': It's the maximum allowed multiplier of the quantity entered in the previous section according to the volume condition.
The settings are for Bitcoin at Binance Futures (BTC: USDTPERP) in 15 minutes.
For other pairs and other timeframes, the settings have to be adjusted again. And within a month, the settings will be different because we all know the market and the trend are changing.
Crypto ZigZag RSI strategy 15minThis strategy is designed for crypto markets like ETHUSD/T, BTCUSD/T and so on.
It works amazingly with 15 min time frames.
Its idea consists in :
We have the RSI indicator, and with it we check for the crossover with overbought and oversold levels. At the same time we have the zigzag which is made from the higher highs and the lower lows between a specific price movement in %.
For entries, they are going to be based on the crossover of rsi with overbought or oversold levels , combined together with cross over 0 line from the the zigzag.
At the same time the strategy has the posibility to go only long, only short or both.
Let me know if you have any questions.
Swing/Daytrading strategy with reversal option
Hello, today I bring a swing reversal strategy that work on all financial markets.
It uses timeframes starting from 1h, the bigger the better.
Its very dangerous because it has no stop loss, neither a take profit. Our exit condition is based on the reversal on the entry .
For entry we have 2 types : normal and reversal
Lets say we want to go long , for that we check the last CLOSE of a candle with the previos HIGH. If its higher than that, and at the same time CLOSE is bigger than the moving average, we have a long entry.
For short we have CLOSE with the previous LOW. If its lower than that and at the same time is lower than moving average, we have a short entry.
For moving average we use T3 MA
For reversal what I do, is , I take the short condition and I apply it to long, and for long I apply the short condition.
On many cases I found out it work amazingly.
I forgot to add: it also has a time entry system, so we use the best hours/sessions for entries .
Exit a trade: lets say we enter short, when we find a long condition, we close short and enter into long. Viceversa for long.
If you have any questions, let me know.
Enjoy it :)
BuyHigh-SellLow StrategyYeah. You read it right. It's not a mistake. It is buy high and sell low strategy.
Main entry condition is to buy when price hits 40 day Donchian channel top. This is combined with my other regular filters which are aligned moving average and new high/low filter and yearly high/low filter.
Exit condition can be based on two things:
Donchian channel : Set appropriate DonchianExitLength. Lower line of donchian channel acts as trailing stop.
ATR Based trailing stop : Select appropriate ATR multiplier and length.
What a surprise!! You can buy high, sell low and still make money.
BTC botI made good money on this bot in last few month so i decided to donate it to community (its from my private bot collection) design for BTC mainly . it a great bot for longs , shity for shorts :)
no security in this bot so no repaint
the key issue in any bot design is to find good low , after you just exit by take profit
the exit strategy here is based on pivot system
entry is based on Low finder script (that i put as open script )
the Take profit system is based on Adolgov script
in reality main problem now is that bot cannot utilize signal from alerts .but we are working to fix this issue with a good that will come soon
this script is to show how to create a smart non repainting strategy using take profit and finding low as the key for it success
this strategy very good for bullish assets. may not work as well when we are on bearish trend so keep this in mind if you use it
Trend Finder V2A variation of a previous indicator i made using two stochastics and a volume weighted moving average to look for trend, 10% equity used per trade at 0.1% commission
The close can be used more of a stop loss if volatility is used to take profit
EMA_cumulativeVolume_crossover[Strategy]This strategy is back test for EMA_cumulativeVolume_crossover
BUY
When ema50 crossover cumulative volume of 100 period
Exit
When ema50 cross down cumulative volume of 100 period
Partial Exit
for the partial profit I have used stopLoss value , but up side. When price is above partial profit and crossing down EMA 50 , exit 1/3 position
Please note when you select this setting, you see spike number of trades, that is because you closing partial number of trades. which increases the winning rate but reduces the total net profit.
Stop Loss
Defaulted to 8%
Added parameter to take LONG or SHORT trades ... on SHORT side not very good results ... you can review it and provide feedback how to improve the performance.
Short Selling
Reverse above BUY conditions
I have tested LONG trades on SPY , QQQ and AAPL on 1 Hour and 30 mins timeframes. for AAPL on DAY timeframe it shows crazy results :-)
Note
For the use of educational purposes only.
Doji swing strategyThis is a simple strategy based on Doji star candlestick
This strategy is suited for big time frames, like 4h -1Day and so on.
It places two orders: long at doji star high or previous candle high and short at doji star low or previous candle low.
It can also be applied volume average, in order to filter between trades .
This strategy works very well with high time frames like Weekly TF because it eliminates the noise in doji formation.
It also has inside a risk management made of SL/TP , or if not prefered it can exit based on a exit condition.
If you have any questions, please let me know !
Multi Time Frame Buy the Dips (by Coinrule)Buying the dips is a relatively easy automated trading strategy that can return impressive profits, especially during uptrend times. Not all price drops are for buying, though. This trading system is based on a multi time frame buy-the-dip approach to optimize each trade.
The strategy catches sudden price drops on a 1-hr time frame when the price increases significantly in the last 12 hours. During steep uptrends, profit-taking price actions result in flash crashes that provide great opportunity to enter at convenient prices.
Buy Condition
The setup of the script is optimized on a 30 min time frame. You can adjust the parameters to fit different time frames.
The system gets a buy signal when
- the price drops 1% from the two previous candles (1 hour time frame = two 30-min candles)
- the price is up 3% from the last 12 hours (twenty-four 30-min candles equal the desired time frame)
Sell Condition
Each trade comes with a stop loss of 3% and a take profit of 4%.
This setup has been optimized, running over 150 backtests on more than 20 different crypto trading pairs.
The strategy assumes each order to trade 30% of the available capital. A trading fee of 0.1% is taken into account. The fee is aligned to the base fee applied on Binance, which is the largest cryptocurrency exchange.
Pinescript v4 - The Holy Grail (Trailing Stop)After studying several other scripts, I believe I have found the Holy Grail! (Or perhaps I've just found a bug with Tradingview's Pinescript v4 language) Anyhow, I'm publishing this script in the hope that someone smarter than myself could shed some light on the fact that adding a trailing stop to any strategy seems to make it miraculously...no that's an understatement...incredulously, stupendously, mind-bendingly profitable. I'm talking about INSANE profit factors, higher than 200x, with drawdowns of <10%. Sounds too good to be true? Maybe it is...or you could hook it up to your LIVE broker, and pray it doesn't explode. This is an upgraded version of my original Pin Bar Strategy.
Recommended Chart Settings:
Asset Class: Forex
Time Frame: H1
Long Entry Conditions:
a) Exponential Moving Average Fan up trend
b) Presence of a Bullish Pin Bar
c) Pin Bar pierces the Exponential Moving Average Fan
Short Entry Conditions:
a) Exponential Moving Average down trend
b) Presence of a Bearish Pin Bar
c) Pin Bar pierces the Exponential Moving Average Fan
Exit Conditions:
a) Trailing stop is hit
b) Moving Averages cross-back (optional)
c) It's the weekend
Default Robot Settings:
Equity Risk (%): 3 //how much account balance to risk per trade
Stop Loss (x*ATR, Float): 0.5 //stoploss = x * ATR, you can change x
Stop Loss Trail Points (Pips): 1 //the magic sauce, not sure how this works
Stop Loss Trail Offset (Pips): 1 //the magic sauce, not sure how this works
Slow SMA (Period): 50 //slow moving average period
Medium EMA (Period): 18 //medium exponential moving average period
Fast EMA (Period): 6 //fast exponential moving average period
ATR (Period): 14 // average true range period
Cancel Entry After X Bars (Period): 3 //cancel the order after x bars not triggered, you can change x
Backtest Results (2019 to 2020, H1, Default Settings):
AUDUSD - 1604% profit, 239.6 profit factor, 4.9% drawdown (INSANE)
NZDUSD - 1688.7% profit, 100.3 profit factor, 2.5% drawdown
GBPUSD - 1168.8% profit, 98.7 profit factor, 0% drawdown
USDJPY - 900.7% profit, 93.7 profit factor, 4.9% drawdown
USDCAD - 819% profit, 31.7 profit factor, 8.1% drawdown
EURUSD - 685.6% profit, 26.8 profit factor, 5.9% drawdown
USDCHF - 1008% profit, 18.7 profit factor, 8.6% drawdown
GBPJPY - 1173.4% profit, 16.1 profit factor, 7.9% drawdown
EURAUD - 613.3% profit, 14.4 profit factor, 9.8% drawdown
AUDJPY - 1619% profit, 11.26 profit factor, 9.1% drawdown
EURJPY - 897.2% profit, 6 profit factor, 13.8% drawdown
EURGBP - 608.9% profit, 5.3 profit factor, 9.8% drawdown (NOT TOO SHABBY)
As you can clearly see above, this forex robot is projected by the Tradingview backtester to be INSANELY profitable for all common forex pairs. So what was the difference between this strategy and my previous strategies? Check my code and look for "trail_points" and "trail_offset"; you can even look them up in the PineScript v4 documentation. They specify a trailing stop as the exit condition, which automatically closes the trade if price reverses against you.
I however suspect that the backtester is not properly calculating intra-bar price movement, and is using a simplified model. With this simplfied approach, the trailing stop code becomes some sort of "holy grail" generator, making every trade entered profitable.
Risk Warning:
This is a forex trading strategy that involves high risk of equity loss, and backtest performance will not equal future results. You agree to use this script at your own risk.
Hint:
To get more realistic results, and *maybe* overcome the intrabar simulation error, change the settings to: "Stop Loss Trail Points (pips)": 100
I am not sure if this eradicates the bug, but the entries and exits look more proper, and the profit factors are more believable.
Noro's SRSI StrategyIndicator
Blue line - common RSI indicator.
Red line - SMA based on RSI
Upper black line - 50% + limit (custom parameter, 65% by default)
Lower black line - 50% - limit (custom parameter, 35% by default)
Strategy
If the red line (SMA) is higher than the upper black line, open a long position (and close the short position).
If the red line (SMA) is lower than the lower black line - open a short position (and close the long position).
For
Cryptocurrencies
Timeframes: 1h, 4h, 1d
Options
1) Length for RSI indicator
2) Length for RSI-based SMA
3) Limit - shift from 50% RSI (above and below, black lines)
Idea
As a rule, if the RSI indicator started to show high values, after that the price rises more often than falls. The opposite is true. When the RSI indicator is at its lowest values for a long time, the price usually keeps falling. The SMA is needed to reduce the error of RSI signals. Limit is needed to reduce a trades (a many trades is a many fees).
Renko Strategy T3 V1An interesting strategy using Renko calculations and Tilson T3 on normal charts targeted for cryptocurrencies but can work with different assets.
Tested on Daily but can work with lower frames using Renko Size and T3 Length adjustments.
== Description ==
Strategy get Renko close/open/high/low values and smooth them with T3 Tilson.
Base on these results the strategy triggers a long and short orders, where green uptrending and red downtrending.
Including Alerts
== Repaint ==
There seems to be some sort of inconsistency when doing 'Replay' function with the strategy, which means using Replay function won't trade like if you see the trading results without Replay. Regarding real time, it does not seem to repaint, besides that you need to wait for the last active bar to complete for it to give you indication.
You can disable strategy to use it has a sole indicator.
There might be a new strategy of Renko Strategy V2 in the future as i have an in progress prototype, Follow to get updated:
www.tradingview.com
Buy the Dips (by Coinrule)Taking your first steps into automated trading may be challenging. Coinrule's mission is to make it as easy as possible, also for beginners.
Here follows the best trading strategy to get started with Coinrule. This strategy doesn't involve complex indicators, yet was proved to be effective in the long term for many coins. Results seem to be improved when trading a coin vs Bitcoin.
The strategy buys the dips of a coin to sell with a profit. A stop-loss protects every trade.
Crypto markets offer high volatility and, thus, excellent opportunities for trading. Excluding times of severe downtrend, buying the dip is a simple and effective long-term trading strategy. The buy-signal is set to a 2% drop in a 30-minutes time frame.
Each trade comes with a take profit and a stop loss. Both set at 2%.
You can adjust these percentages to the market volatility as an advanced setup. You can backtest the outcomes using the backtesting tool from Tradingview
The strategy assumes each order to trade 30% of the available capital. A trading fee of 0.1% is taken into account. The fee is aligned to the base fee applied on Binance, which is the largest cryptocurrency exchange.
SuperTREX strategyThis is the strategy of Super Trex that i put as open source before
i just add option for non security MTF and take profit steps as i shown before
for different coins or assets you need to set different parameters
RSI of VWAPThis strategy inputs the vwap as source to RSI indicator.
ENTRY
When RSIofVwap crossover 70 and price is above ema200
partial exits
when RSIofVwap reaches 90 level take a portion of profit
Exit
When RSIofVwap crossdown 30
stoploss
defaulated to 5%
Risk Level
Defaulted to 10%. Based on this startegy calcuclates hiw many units can be purchased adhering to stoploss value
Note: code doesnt draw the RSI (vwap) indicator to the chart. if you want to see how these signals are generated , you can select RSI and VWAP of 14 period length.
warning
For educational purposes only
Backtest Custom HiLo StrategyThis script implements the HiLo trend follower strategy for backtesting the HiLo indicator. It comes with some custom options. Among them is the Type option that allows to choose between the moving averages for the highs and lows (HiLo), or highest and lowest values for those moving averages, respectively (HiLo Activator).
Long only strategy VWAP with BB and Golden Cross EMA50/200
This is strategy, mainly designed for stock markets
It makes uses of the EMA 50/ 200 ( Golden cross) and VWAP and Bollinger bands.
It only takes long positions. It can be adapted to all time frames, but preferably to be used with longer timeframes 1h +
The rules for entry are the next ones :
1. EMA50 > EMA 200
2. if current close > vwap session value
3. check if price dipped BB lower band for any of last 10 candles
EXIT RULE
1. price closes above BB upper
STOP LOSS EXIT
1. As configured --- default is set to 1%
Short In Downtrend Below MA100 (Coinrule)This is a simple strategy to take advantage of downtrends. It's useful to run such a strategy as a hedge in times of market uncertainty.
The Sell Condition - Entry
The sell signal triggers when:
the coin has MA (100) greater than the price in a timeframe of 15 minutes, meaning that the coin is in a short-term downtrend.
the coin has an RSI greater than 30 in a timeframe of 15 minutes, indicating that it didn't reach oversold conditions yet, so there is still room for a further price drop.
On Coinrule, you can launch the strategy on real market conditions, setting up multiple sequential sell orders. The strategy would keep selling while the price stays below the MA(100). In that case, it's advisable to set low amounts for the sell orders. the position will grow gradually while the downtrend intensifies. Set a minimum time interval between the sell orders will also help to have control over the overall position size.
The Buy Condition - Exit
The bot connects to each trade a stop loss and a take profit. The percentages are optimized for short term trades on mid-cap coins. You can adjust the percentages depending on the specific coin you are trading. A ratio of 1:1.5 between the stop loss and the take profit could work as the strategy trades in the same direction of the trend.
Stop loss at 3% from the entry price
Take profit at 2% from the entry price
A slightly larger stop loss allows tolerating more volatility to reduce the case of stops triggering when it shouldn't.