ビットコイン、調整終わった?ヒットコイン、週足です。
上昇と調整の時間の比率を見ると、前回の上昇と調整の比率が約75:25です。
もし、今回も同様の比率だとすると、そろそろ、調整が終わるかもしれません。
日足です。
4時間足です。水平線の攻防です。
BTCUSDのトレードアイデア

BTCUSD 1月31日ビットコインBybitチャート分析です。こんにちは
ビットコインガイドです。
「フォロワー」をしておけば
リアルタイムの移動経路や主要区間からコメント通知を受け取ることができます。
私の分析が役立つ場合
下部にブースターボタン一つずつお願いします。
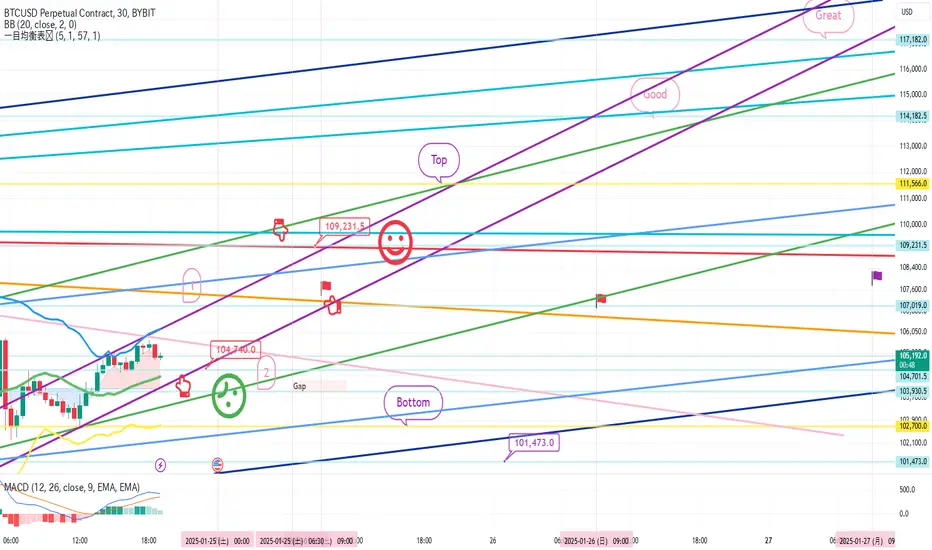
ビットコインの30分チャートです。
しばらくして10時30分ナスダック指標発表が2つあります。
ナスダックでは、上部と下部にGap区間があります。
一回振る可能性が高く見えます。
ビットコインは4時間チャートMACDデッドクロス圧迫があります。
テザードミナンスと比べて今日の戦略を作りました。
*空色指移動経路
双方向ニュートラル
ショート->ロングスイッチング、またはロングポジション待機戦略
1. 104,641.5火ショートポジション進入区間 / オレンジ色抵抗線突破時手節街
2. 103,12ドル ロングポジションスイッチング / 緑色支持線離脱時の手折り
(すぐ下がる場合、104.6Kがロングポジション待機区間、手節が同じ)
3. 106,943ドル ロングポジション 1次ターゲット -> 順番にターゲットが
4時間チャートMACDデッドクロスを無視するには
上部に1番区間以上、ボリンジャーバンド4時間チャート抵抗線をタッチしてくれる
条件になります。
そうでなければ
4時間キャンドルが生成される9時、1時、5時まで
横歩しながら刻印されなければなりません。
その基準で戦略を作りました。
上部に1番区間は横歩区間/下部に水色支持線は
中期の観点から上昇傾向線となります。
緑色の支持線が壊れた場合
Bottom -> 2回まで一気に降りることができるから
注意してください。
今日の体調が悪い
ここで仕上げて入ってみましょう。
ここまで、
原則売買、手折が必須で安全に運営していただきたいと思います。
ありがとうございます。

本日のビットコイン1/26(日)#1
本日のビットコインは、ブルーのチャネルにご注目ください。「逆三尊」を形成しています。
今現在のところ、チャネルの中を上下しているため各SMAも収縮しており、拡散のタイミングを待っている状況です。
定番通りにいけば、上に上がっていくことになりますが、逆三尊の「否定」というケースもあり得るので、どちらに抜けていくか、はっきりと見届けてからエントリーするほうがいいですね。

本日のビットコイン1/25(土)#1
本日のビットコインについて見ていきましょう。
まずほ、SMAだけを表示したチャートです。
明確なトレンドが出ておらず、判断の難しい相場ということがおわかりいただけるかなと思います。
強いていうなら、赤の20SMAが上がってきたところを押さえつけられて、紫の40SMAと黄色の75SMAを下抜け用としているので、ショート目線になるのかなといったところです。
ラインを引いてみると、今現在はブルーの水平線がひけます。場合によっては、ディサンディングトライアングルとも見られるかもしれません。ということは、やはりショート目線になると思われます。
ただし、どこまで落ちていくのかは判断のつかない状況ですので、もう少し明らかになるまでは様子見がいいかと判断します。今後エントリーする場合は、ショート目線で見ていくのが、期待値の高いトレードになるはずです。

2025 01 第4週 BTC Lエントリー日足
WBのネックを上抜け週足高値で止まり
裏チャネルと日足20MAへ押しをつけてきた
4H
日足チャネルと日足20MA上で、4HWB、(右肩に当たる大きな陽線で)を形成と見た
Lエントリー
SL
4H1つ下の安値(WBの左肩)

(旧正月特集)BTCUSD 1月24日ビットコインBybitチャート分析です。こんにちは
ビットコインガイドです。
「フォロワー」をしておけば
リアルタイムの移動経路や主要区間からコメント通知を受け取ることができます。
私の分析が役立つ場合
下部にブースターボタン一つずつお願いします。
ビットコイン4時間チャート
主な作図区間です。
作図するのに2時間半ほどかかったようですね。
フラグが表示されている区間は、一棒グラフが生成される区間です。
最後の旗が休日が終わる1月31日です。
今週は少し荒々しくて奇妙に
問わないで上昇、問わないで下落が繰り返されています。
その理由が報告が更新された後
前回のビデオで詳しく説明したように
ビートが暴得する直前の席だからです。
ボリンジャーバンド主棒チャート基準で抵抗線を先にタッチするか
(対象乗場)
主棒チャートMACDデッドクロスが最初に進行したとき
調整と横歩が出るかどうかが重要です。
その基準で、右側で高点と低点を見ると
価格表示をしました。
一番上に117,182ドルが主棒チャート抵抗線をタッチしながら
中期上昇傾向への動き
下部に99703火を最初に離脱する場合
主棒キャンドル底点が割れる場所になります。
作図した明るい色の水色の支持線の2本を離脱したら悪いでしょう。
横歩と支持ラインが壊れる場所なので
主な区間を計算した場所です。
参考にしていただければと思います。
ビートと逆に動くテザードミナンス30分棒チャートです。
今日のパターンで
5分棒、15分棒抵抗線に触れました。
30分棒チャート抵抗線区間順です。
水色の指区間/強い下落区間で
ショートポジション戦略を進めました。
テザードミナンスの場合
現在6時間チャート、12時間チャートMACDデッドクロスが行われています。
そのままビットコインに代入させました。
ビットコインの30分チャートです。
今夜12時ナスダック指標発表一つあります。
ナスダックは6時間チャートMACDデッドクロスが進行中です
この区間は大きく危険ではないと判断しました。
まだ短期パターンが生きています。
主棒チャートにはMACDゴールデンクロスが刻印されています。
ナスダックで調整が強く出ても
1 + 4上昇パターンが待っているので
上昇に重みを置いて戦略を進めました。
*赤い指の移動経路
ワンウェイロングポジション戦略
1. 104740火 ロングポジション入口区間 / 緑色支持線離脱時の手節街
2. 109,231.5ドル ロングポジション 1次ターゲット -> Topから順にターゲットが
テザードミナンスの動きとビットコインパターンで見たとき
30+1パターンで反騰が出るのにフォーカスを合わせました。
1番区間までは横保障です。
Top区間からは届出が更新ですが、ここまで届くと
ずっと大きく上昇します。
ナスダックから強い調整が出るのに備えて
最終ロングポジション待機区間へ
表示した2番区間30分サポート+ 1時間サポートまで
手折りを維持しました。
今日Bottomセクションに触れると
一峰チャートの底が壊れているので、それは良くありません。
一番下に101.4Kまで落ちた場合
昨日復旧できなかった6+12パターンに注目してください。
基本的にこの区間まで降りる場合
ボリンジャーバンド12時間チャート中央線に何度も触れました。
6時間チャートの支持線も開いていて良くありません。
上段に重機関店で説明した最終支持ラインを参考にしてください。
今日は久しぶりに説明も詳しく説明しました。
最善を尽くして一週間の分析を行いました。
実取引にお役立ていただければ幸いです。
ここまで、
原則売買、手折が必須で安全に運営していただきたいと思います。
せっかく長期休業日なのに
チャートだけを見ないでください。
フォロワーの皆さん、来週の新年の家族
楽しい時間を過ごしてほしいです。
明けましておめでとうございます。
いつもありがとうございます。
BTCUSD 1月20日ビットコインBybitチャート分析です。こんにちは
ビットコインガイドです。
「フォロワー」をしておけば
リアルタイムの移動経路や主要区間からコメント通知を受け取ることができます。
私の分析が役立つ場合
下段にブースターボタン一つずつお願いします。
ビットコインの30分チャートです。
今日のナスダックは休場であり、横歩き可能です。
ビットの場合、報告は更新が進行中です。
以前に予想通り動きが出ていますが。
最も重要な部分は、主棒チャートMACDデッドクロスの進行があります。
ボリンジャーバンド主棒チャート抵抗線に触れる場合
デッドクロスは無視され、引き続き上昇する可能性がありますが
タッチできない場合、
横断しながらデッドクロス刻印が行われる必要があるため
中期時点で横表示間が長くなることがあります。
今日もトレンドフォローに基づいて
*赤い指の移動経路
ワンウェイロングポジション戦略
1. 107,086.5火 ロングポジション進入区間 / 緑色支持線離脱時の手折り
2. 113,417ドルロングポジション1次ターゲット -> Good 2次ターゲット
上部にGood区間は主棒チャートボリンジャーバンド抵抗線です。
この区間タッチからは自律的にショートポジション運営を進行してもよい
報告は更新から上下に大きく振ることができます。
手節価格は無条件に進むべきです
緑色の支持線から - >ボトムまでキャンドルでチャンデヤンボンが進行中です
いっぱいのキャンドルなので横にしても
ボトムまで降りないで
支えてあげなければなりません。
ここまで、
原則売買、手折が必須で安全に運営していただきたいです。
ありがとうございます。

本日のビットコイン1/24(金)#1
昨日の投稿と合わせてご覧いただくとわかりやすいので、そちらもお願いします。
昨日の朝の段階でブルーのチャネルは上抜けられず、20SMAにおさえつけられる形で下落を続けていました。
しかし、昨夜チャネルを上抜けすると、ショート勢の損切りを巻き込みながら一気に上昇をしていきました。
おそらくまだその上昇は継続すると見られます。利確ポイントは、ブラックのチャネルの上限。損切りを巻き込んでまだ上昇する余地もあるなで、グリップし続けるのもありかもしれません。

ビットコイン、下げ止まりを待つ日足は、ダブルトップ、4時間足は、三尊を形成しそうに見えます。
ダマシになるかもと、考えています。
11月ごろからの現在のレンジは難しいです。
日足の水平線を、抜ければ、ショートも考えますが、現状は、下位足の下落が、どこで反転するかを確認することが、優先だと考えています。
4時間足です。

本日のビットコイン1/23#1
ビットコインについてみていきます。
上昇の一服を終え、再度上昇する兆しを見せています。
ブルーの切り下げチャネルを上抜け、赤の20SMAが上向いてくれば、アップトレンド継続になります。
ただ、売りの圧力が強く、チャネルを上抜けても20SMAが上向かなければ、押し戻されます。必ず20SMAの傾きも考慮に入れてエントリーしたいところです。
よく言いますよね。
「しっぽとあたまはくれてやれ」
相場の格言ですね。しっぽからとれなくても利益を取ることを最善の目標としていきましょう。
もし押し戻されるようなことがあれば、また戦略は変更になるのでそのときに投稿します。

本日のビットコイン1/20(月)#1
昨日の投稿では、ダブルボトムの形成からのアップトレンドになるのではないかという内容の投稿をしましたが、高値付近で押さえつけられてしまい、切り上げチャネルの形にしてなりました。
ここにきて、このブルーのチャネルを下抜ける動きになってきましたので、一旦下落していくという見方になります。
決済ポイントはブラックのチャネルの下限とになります。
トリガーとしては、今は落ちてきていますが、一度戻しますので、戻しが入ったところでエントリーとしたいと思います。

BTCUSD Weekly Log Chart -AlgoAlpha Adaptive SuperTrend and RSITitle: Navigating Bitcoin's Bearish Waters: A Probabilistic Approach to BTCUSD with AlgoAlpha Indicators and Monte Carlo Simulation
The cryptocurrency market, and Bitcoin (BTCUSD) in particular, has been navigating choppy waters recently. As investors grapple with uncertainty, it's crucial to employ a multi-faceted approach that combines technical analysis with probabilistic models to make informed decisions. In this article, we'll delve into a comprehensive analysis of BTCUSD, leveraging the power of two sophisticated indicators from AlgoAlpha : the Machine Learning Adaptive SuperTrend and the Supertrended RSI, alongside a Monte Carlo simulation to project potential price paths and a Fermi estimation approach to define realistic profit targets and stop-loss levels.
The Bearish Narrative: A Confluence of Signals
Our analysis begins by examining the current state of BTCUSD through the lens of weekly and daily charts. The picture that emerges is predominantly bearish:
Weekly Chart (Logarithmic Scale): The long-term uptrend of Bitcoin is undeniable on a logarithmic scale. However, the current price action indicates a significant correction or a potential prolonged bear market. The Adaptive SuperTrend on this timeframe is flashing a red signal, indicating a bearish trend. This indicator's strength lies in its adaptive nature; it uses K-Means clustering to dynamically adjust to volatility, which is currently classified as high (Cluster 3). This suggests the bearish signal is adapting to the increased market swings, potentially making it more reliable. The Supertrended RSI complements this view, also showing a bearish trend and residing below its signal line, further reinforcing the downward momentum.
Daily Chart: The daily chart confirms the bearish sentiment. The price is trading below the red Adaptive SuperTrend line, which is acting as dynamic resistance. While the volatility might be transitioning from high to medium, the "Cluster Number" still reflects high volatility context from the weekly. The Supertrended RSI recently turned bearish, shifting from a brief bullish period, indicating a potential continuation of the downtrend.
Key Support and Resistance Levels: Defining the Battleground
Identifying key support and resistance levels is paramount. Based on our analysis, these are the levels to watch:
Resistance (Daily): The Adaptive SuperTrend line (currently around $104,000), and the recent highs in the $107,000-$108,000 zone.
Support (Daily): The immediate support lies around $96,500 (recent low).
Support (Weekly Log): Further down, potential support zones are identified around $88,000-$90,000, $60,000, $30,000, and the psychologically significant $20,000 level (the peak of the 2017 bull market).
Monte Carlo Simulation: Charting Potential Paths
www.luxalgo.com
To add a probabilistic dimension to our analysis, we turn to a Monte Carlo simulation. This technique generates multiple potential price paths for BTCUSD based on random sampling, incorporating factors like historical volatility and the current trend.
The simulation reveals a downward bias, with a significant proportion of the projected paths trending lower. While some paths show upward movement, the overall picture aligns with the bearish technical outlook. Notably, some simulated paths reach down towards the $80,000, $70,000, and even $60,000 levels, reinforcing these as potential support zones. The simulation also visually confirms the high volatility environment, with a wide range of potential outcomes.
Fermi Estimation: Setting Realistic Targets and Stop-Losses
In the absence of absolute certainty, Fermi estimation helps us make educated guesses about reasonable price targets and stop-loss levels. Integrating insights from the technical analysis and the Monte Carlo simulation, we can estimate the following:
Most Likely Range (Next Few Weeks): $80,000 - $96,500. This range considers the downward bias of the Monte Carlo simulation, the bearish technical indicators, and the key support and resistance levels.
Lower Bound: $60,000-$70,000, aligning with some of the lower Monte Carlo paths and strong support on the log chart.
Upper Bound: Capped around $110,000 in the short term, given the strong resistance at the daily SuperTrend line and the recent highs.
Trading Ideas for the Astute Investor
Based on this multi-faceted analysis, here are a few potential trading ideas:
1. Bearish Continuation (Primary Scenario):
Entry: A decisive break below the $96,500 support on the daily chart, confirmed by the Supertrended RSI continuing its downward trajectory and accompanied by increased volume.
Profit Targets:
Initial: $88,000-$90,000 (psychological support).
Secondary: $80,000 (Monte Carlo simulation and historical support).
Extended: $70,000-$60,000 (stronger support on the log chart and lower range of Monte Carlo paths).
Stop-Loss: Initially placed above the most recent swing high (around $103,000) or above the daily SuperTrend line. A trailing stop-loss, potentially guided by the SuperTrend line, is recommended to lock in profits as the trade moves favorably.
2. Short-Term Long (Counter-Trend - High Risk):
This scenario is less probable given the strong bearish signals on both the weekly and daily charts, as well as the downward bias in the Monte Carlo simulation.
Entry: Only for very aggressive traders, a cautious long entry might be considered if a strong bullish reversal pattern emerges at the $96,500 support AND the daily Supertrended RSI crosses decisively above its signal line.
Profit Targets:
Initial: The daily SuperTrend line (around $104,000).
Secondary: The $107,000-$108,000 resistance zone.
Stop-Loss: A very tight stop-loss should be placed below the $96,500 support or below the low of the bullish reversal candle (if any).
3. Range-Bound Trading (Less Likely):
While possible on the daily chart, a sustained range-bound market on the weekly timeframe seems less likely given the strong bearish trend and high volatility.
If a consolidation pattern emerges between $96,500 and the daily SuperTrend resistance, a range-bound strategy could be employed, but with caution.
The AlgoAlpha Advantage: Adaptive and Trend-Filtered Insights
The Machine Learning Adaptive SuperTrend and the Supertrended RSI provide unique advantages in this analysis:
Adaptive SuperTrend: Its ability to adjust to different volatility regimes using K-Means clustering makes it potentially more reliable than a traditional SuperTrend, especially in the current high-volatility environment.
Supertrended RSI: By applying the SuperTrend concept to the RSI, this indicator filters out noise and provides momentum signals that are aligned with the underlying trend, enhancing the clarity of the analysis.
Conclusion: Navigating with Caution
The confluence of bearish signals across multiple timeframes, the downward bias in the Monte Carlo simulation, and the insights provided by the AlgoAlpha indicators suggest that the path of least resistance for BTCUSD is to the downside. While short-term fluctuations are possible, investors should exercise caution and prioritize risk management.
The key support level at $96,500 on the daily chart is a critical juncture. A decisive break below this level could open the door to further declines, potentially towards the lower support zones identified on the weekly logarithmic chart.
About me -FibonacciFlux
Transform your trading ideas into powerful, automated strategies. I am a top 30 Pine Script coder in Japan, specializing in creating custom indicators tailored to your needs. With a background in AI and proven success in developing profitable bots (including a Gate.io rebalance bot with over 400% ROI), I offer the expertise to elevate your trading. My indicators have also garnered over 400 boosts from the community. Contact me today to discuss your project.
Click here to upwork
Disclaimer: This article is for informational purposes only and should not be considered investment advice. Trading cryptocurrencies involves significant risk. Always conduct your own research and due diligence before making any trading decisions. Remember, past performance is not indicative of future results, and it's crucial to manage your risk effectively. Never invest more than you can afford to lose.

Forecast of the future price of Bitcoin: technical analysisData and Logic-Driven Scenarios for Bitcoin's Victory
Hello everyone. I'm FibonacciFlux, an algorithmic trader at FibonacciFlux . I'm a partner of AlgoAlpha , a platform that offers institutional-grade, sophisticated analytical tools on TradingView, a platform loved by traders worldwide.
When investing in Bitcoin (BTC), what indicators do you rely on?
There are various technical indicators like moving averages, RSI, MACD, etc. But this time, we'll be using the "Limited Growth Stock-to-Flow Model (LG-S2F)" which is useful for long-term price prediction, to analyze the current movements of BTC and decipher its mid-to-long-term future.
In this analysis, I'll first explain the overview of the LG-S2F model, followed by a technical analysis using the monthly chart. After that, I'll present three scenarios for BTC prices from 2024 onwards and discuss the possibilities of each.
You might be thinking, "This sounds complicated with all the technical terms..." But don't worry. Here, even difficult technical terms will be explained using everyday language, along with illustrative examples for better understanding.
Furthermore, I'll present clear profit targets and stop-loss areas to clarify concrete trading ideas. Through this analysis, I hope to help you understand the long-term price trends of BTC and contribute to improving the accuracy of your investment strategies.
What is the LG-S2F Model?: A Story of Value Woven by Scarcity
Stock-to-Flow (S2F) Model: The Analogy with Gold
First, let me briefly explain the Stock-to-Flow (S2F) model. This model quantifies the scarcity of an asset and measures its value. Imagine gold as an example.
Stock: The total amount of gold that exists on Earth (e.g., about 4 Olympic swimming pools).
Flow: The amount of gold newly mined in a year (e.g., about 1/10th of an Olympic swimming pool).
The stock of gold is vast, but the flow is limited. In other words, gold is scarce. This scarcity is precisely what supports the value of gold.
The S2F model uses the value obtained by dividing the stock by the flow (S2F ratio) to quantify the scarcity of an asset.
S2F Ratio = Stock ÷ Flow
For example, the S2F ratio of gold is about 60. This means that if we continue mining at the current pace, it will take about 60 years to catch up with the total amount of gold on Earth.
Bitcoin's S2F Ratio: Creating Value for Digital Gold
Like gold, Bitcoin has a limited supply (21 million BTC). Furthermore, the "halving" event, which occurs approximately every four years, halves the new issuance (flow).
In other words, Bitcoin's S2F ratio will continue to increase over time, and its scarcity will increase.
Limited Growth S2F (LG-S2F) Model: Adapting to the Real World
The traditional S2F model assumed a linear relationship between the S2F ratio and price. However, in reality, there is a limit to price increases.
This is where the LG-S2F model comes in. This model adds the concept of "limited growth" to the traditional S2F model, representing a more realistic scenario where the rate of value increase gradually diminishes over time (growth gradually slows down).
Furthermore, the LG-S2F model visualizes the uncertainty of the prediction by displaying statistical error ranges (error bands). AlgoAlpha's LG-S2F model enables long-term price prediction of Bitcoin based on these theories.
Monthly Chart Analysis: Finding the Path to the Future from Past Footprints
Now, let's analyze the Bitcoin monthly chart using AlgoAlpha's LG-S2F model.
Chart Used: BTC/USD Monthly Chart (BITSTAMP)
Period Displayed: 2012 to Present (January 2025)
Chart Components:
Candlesticks: Represent the monthly price fluctuations of Bitcoin.
Predicted Price (Gray Line): The theoretical price of Bitcoin predicted by the LG-S2F model.
Upper Error Band (Red Shades): The upper range of price fluctuations calculated from past data. This area tends to act as a strong resistance zone.
Lower Error Band (Green Shades): The lower range of price fluctuations calculated from past data. This area tends to act as a strong support zone.
Current Price: Approximately $104,278 (as of January 2025)
Resistance and Support Zones: Historical Price Movement Patterns
Looking at the past chart, we can see that the upper and lower error bands have functioned as resistance and support zones, respectively.
Resistance Zone (Upper Error Band): When the price reaches this area, selling pressure tends to increase, and adjustments or declines are likely to occur.
Support Zone (Lower Error Band): When the price reaches this area, buying pressure tends to increase, and rebounds or rises are likely to occur.
Examples:
2013, 2017, 2021: The price reached the upper error band and then fell sharply.
2015, 2018, 2022: The price rebounded from the lower error band and transitioned to an upward trend.
Upper Error Band: An Unbreakable Wall?
Key Point to Note: In the past monthly chart, the price of Bitcoin has never clearly broken above the upper error band and maintained that level.
Current Situation (January 2025):
Looking at the latest provided chart, we can confirm that the January 2025 monthly candle has a long upper wick and is facing strong resistance near the upper error band.
Thought Process & Reflection: The price movement in January 2025 is different from the past few times. It has not clearly broken above the upper band and is showing a long upper wick, indicating resistance. This suggests that the upper error band is functioning as an even stronger resistance zone than before. I've double-checked this observation against the chart and my understanding of historical patterns. This observation is crucial as it hints at a potential trend change or consolidation.
Lower Error Band: Risk of a Major Crash?
On the other hand, the lower error band has functioned as a support zone multiple times in the past. This suggests that the risk of a sudden, significant drop in the Bitcoin price is relatively small.
However, if the price clearly breaks below the lower error band, as it did in late 2014 to 2015 and late 2018, it could signal the beginning of a long-term bear market. Therefore, maximum caution is needed for movements that break below this level.
Thought Process & Reflection: The lower error band's history as a support zone provides a degree of confidence. I cross-referenced the historical data and confirmed the instances where it held. This reflection reinforced my understanding of the risk being relatively contained, though not entirely eliminated. The potential for a bear market if the band is breached highlights the importance of stop-loss orders.
Scenario Analysis: Predicting BTC Price from 2025 Onwards
Based on the above analysis, let's consider three scenarios for Bitcoin's price from 2025 onwards.
Thought Process:
Grasping the Big Picture:
* Bitcoin has a limited supply.
* Historically, the price has risen significantly after halving events.
* From these facts, we can assume that the long-term uptrend will continue.
Using the LG-S2F Model's Prediction as a Base:
* The model suggests that the price will grow in a limited manner over time and fluctuate within a certain range (error bands).
Referring to Past Patterns:
* The upper error band has functioned as a strong resistance zone.
* The lower error band has functioned as a strong support zone.
Focusing on Recent Price Movements:
* In March 2024, and currently in January 2025, there is an upper wick near the upper error band, indicating resistance.
Considering External Factors:
* Consider factors that could affect Bitcoin's price, such as monetary policy, regulations, and technological innovations.
Scenario 1: Range-Bound Market Formation (Probability: High)
Short-Term (Within 2025):
Since the current price (about $104,278) is near the upper error band, upside is likely to be heavy . There is a high probability of a range-bound market forming between the upper error band and the predicted price (around $70,000 to $110,000).
Mid-Term (Around 2026-2028):
The range-bound market around $70,000 to $110,000 continues on a logarithmic scale. The lower error band continues to function as a strong support line, and a significant decline is expected to be avoided.
Trade Idea:
Profit Target: Around $110,000 (upper range, near the upper error band).
Stop-Loss Area: Around $68,000 (predicted price and lower range).
Strategy: A range-bound, mean-reversion strategy of buying near the lower error band (around $70,000) and selling near the upper error band (around $110,000). After confirming the formation of a range-bound market around the predicted price ($70,000 to $110,000), take a counter-trend trade near the upper and lower limits of the range.
Thought Process & Reflection: This is the scenario I consider most likely. The upper error band is a strong resistance zone, and based on past patterns, the probability of breaking above it in the short term is low. The lower error band is functioning as a strong support zone, so I believe the risk of a significant decline is small. The profit target and stop-loss area are set based on the anticipated range. I believe this is a solid strategy given the current technical setup. I've double-checked these price levels against the chart, and they align with the expected range boundaries.
Scenario 2: Resumption of Bull Market (Probability: Medium)
Short-Term (Within 2025): The upper error band acts as resistance, potentially leading to an adjustment phase.
Mid-Term (Around 2026-2028): Positive factors such as the next halving, increased institutional investor participation, and advancements in Bitcoin-related technology. After forming a range-bound market, there is a possibility of a return to an upward trend, clearly breaking above the upper error band.
It's conceivable that the price could aim for the previous all-time high of around $70,000, the key psychological level of $100,000, and then the next upper band around $150,000 and $200,000. Looking at the past, the resistance of the upper band is strong, and significant upward pressure is needed to break through it.
Trade Idea:
Profit Target: $150,000 and $200,000 (previous all-time high, psychological round number, next upper band).
Stop-Loss Area: Around $68,000 (lower range).
Strategy: Consider taking profits near the upper error band. If looking for a dip-buying opportunity, the predicted price area ($70,000 to $110,000) or the lower error band are candidates. If the price clearly breaks above the upper error band, ride the upward trend while raising the stop-loss line.
Thought Process & Reflection: I consider this scenario to have a medium probability. There are bullish factors like the next halving and institutional investment. However, the resistance of the upper error band is very strong and has never been clearly broken in the past, so caution is needed. I believe a strategy that assumes a range-bound market while preparing for a breakout is effective. The profit targets are ambitious but technically justified, and the stop-loss is placed to manage risk if the breakout fails. I re-examined historical data and confirmed that previous bull runs have seen similar percentage gains, lending credence to these targets.
Scenario 3: Transition to Bear Market (Probability: Very Low)
Short-Term (Within 2025): The upper error band acts as resistance, potentially leading to an adjustment phase.
Mid-Term (Around 2026-2028): Negative factors such as increased regulations by major countries, the revelation of fatal technical flaws in Bitcoin, and the emergence of cryptocurrencies with superior functionality.
Investor sentiment cools, and the price could fall below the predicted price and even the lower error band. A long-term bear market could ensue, potentially aiming for below $10,000 on a logarithmic scale.
However, in 2015, 2018, and 2022, the lower error band functioned as a strong support zone. Therefore, I consider the probability of this scenario to be very low .
Trade Idea:
Profit Target: Around $68,000 (predicted price), around $40,000 (near the lower error band).
Stop-Loss Area: $110,000 (recent high), $150,000 (upper error band).
Strategy: The area near the upper error band is a good opportunity for a short-selling on a rebound. Pay close attention to whether the price stops falling near the predicted price or the lower error band. If the price clearly breaks below the lower error band, strictly enforce the stop-loss and prepare for a bear market.
Thought Process & Reflection: I believe this scenario is very unlikely. The lower error band has a proven track record as a strong support zone. Considering Bitcoin's technological advantages and network effects, the probability of its value going to zero in the long term is low. However, investment always carries risk. It's crucial to thoroughly manage risk by setting stop-loss lines in case a bear market does occur. I re-evaluated potential black swan events that could trigger this scenario, and while possible, they seem improbable given the current landscape. The profit targets and stop-losses are set to capitalize on a potential drop while minimizing losses if the market continues its upward trajectory.
Code Explanation: Mathematical and Algorithmic Details
Below is a detailed explanation of the main parts of the code from a mathematical and algorithmic perspective.
1. Data Acquisition: BTC Supply and Block Height
s = request.security("BTC_SUPPLY", "D", close)
h = request.security("BTC_BLOCKS", "D", close)
request.security() function: A built-in Pine Script function to retrieve historical data for a specified symbol.
"BTC_SUPPLY": The ticker symbol to retrieve Bitcoin's total supply data.
"BTC_BLOCKS": The ticker symbol to retrieve Bitcoin's block height (total number of blocks generated) data.
"D": Specifies the timeframe for data retrieval as daily.
close: Specifies that the closing price data should be retrieved.
Bitcoin Supply (s):
Bitcoin's total supply is programmatically determined by an algorithm based on the halving of mining rewards. The halving event, which occurs approximately every four years, halves the reward paid to miners. This supply data is a crucial component that constitutes the "stock" in the LG-S2F model .
Block Height (h):
Block height represents the total number of blocks since the Bitcoin blockchain started generating. Since blocks are generated approximately once every 10 minutes, the block height continues to increase over time. Block height is used to accurately determine the timing of halvings and indirectly affects Bitcoin's supply, i.e., the "flow."
ae1 = 0.17/2
ae2 = 0.17
ae3 = 0.17*(3.0/2)
be1 = 0.02/2
be2 = 0.0
be3 = 0.02*(3.0/2)
ce1 = (22.71000000000000)/2
ce2 = 22.71000000000000
ce3 = (22.71000000000000)(3.0/2)
Code Overview
This part of the code defines the coefficients for calculating the "error bands," which are essential for evaluating the prediction accuracy of the LG-S2F model and visualizing its confidence intervals. It uses the model's key parameters a, b, and c, along with their corresponding standard errors, to prepare for the calculation of the upper and lower bounds of the error bands.
Parameter Details
a, b, c: These are the core coefficients that make up the formula of the LG-S2F model. Their values are estimated using statistical methods (e.g., regression analysis) based on historical Bitcoin price data and stock-to-flow ratios. These parameters play a crucial role in determining the shape of the model, that is, the trajectory of the Bitcoin price prediction.
a: The scaling coefficient that serves as the basis for price prediction. It adjusts the overall height of the model.
b: The coefficient representing the diminishing growth effect over time. The larger this value, the more rapidly the growth slows down.
c: The coefficient that adjusts the relationship between the stock-to-flow ratio and the price.
ae1, ae2, ae3, be1, be2, be3, ce1, ce2, ce3: These values relate to the standard errors of parameters a, b, and c, respectively. They represent the magnitude of uncertainty (error) in the estimation of each parameter. These values indicate how reliable the estimates of a, b, and c are.
Calculation of Standard Errors: These values are derived from regression analysis or similar methods using historical data. For example, the specific numbers like 0.17, 0.02, and 22.7*1000000000000 reflect the results obtained from statistically fitting the model to past Bitcoin price and stock-to-flow data sets. These numbers are influenced by many factors, including the size of the dataset, the variability of the data, and the complexity of the model.
Some values are divided by 2 (like ae1 = 0.17/2, be1 = 0.02/2, ce1 = (22.7*1000000000000)/2). This is an adjustment to determine how much to extend the error bands above and below the central prediction, based on the standard error. Often, the error bands are drawn using multiples of the standard error (e.g., 1x, 2x, 3x) as the upper and lower widths.
a1a, a1b, a1c, a2a, a2b, a2c, b1a, ..., c2c: These variables are calculated by adding or subtracting the variation amount, related to their respective standard errors, to or from the parameters a, b, and c. These variables are used to calculate the upper and lower limits of the error bands, defining the range of uncertainty in the model prediction.
Example: a1a = a + ae1: This calculates the upper limit that the value of 'a' can take by adding the variation amount ae1, related to its standard error, to the estimated value of parameter a.
Application to Error Bands: These variables are used to create multiple combinations of parameters, and the price prediction is calculated for each combination. This allows us to evaluate the range of the impact that parameter estimation errors have on the price prediction and to visualize it as error bands.
Mathematical and Algorithmic Background
Error Propagation:
The key concept behind this code is "error propagation." It is a statistical method that quantifies how errors in the parameter estimation of the model affect the final predicted value (in this case, the price of Bitcoin).
Estimation of Confidence Intervals:
Using the concept of error propagation, the confidence interval (error band) of the predicted value by the model is estimated. This allows us to present a more realistic range of price predictions that takes into account the uncertainty of the predicted value.
Linear Approximation:
Calculations like a1a = a + ae1 are based on a linear approximation to simplify the calculation of error propagation. This approach has the advantage of being easy to compute. However, if the model is non-linear, applying non-linear error propagation that considers higher-order terms might be desirable.
p = (1/s)(cmath.exp(wrt))
p1a = (1/s)(c1amath.exp(w1ar1at1a))
p1b = (1/s)(c1bmath.exp(w1br1bt1b))
p1c = (1/s)(c1cmath.exp(w1cr1ct1c))
p2a = (1/s)(c2amath.exp(w2ar2at2a))
p2b = (1/s)(c2bmath.exp(w2br2bt2b))
p2c = (1/s)(c2cmath.exp(w2cr2ct2c))
Code Overview
This section calculates the core price prediction of the LG-S2F model, combining elements of the limited growth model and the stock-to-flow model.
Variable Explanation
w, e, r, t: These are intermediate variables used to calculate the final predicted price p, introduced to simplify the formula.
p: The variable for calculating the theoretical price of Bitcoin (central prediction) predicted by the LG-S2F model.
p1a, p1b, p1c, p2a, p2b, p2c: These variables are used to calculate the upper and lower limits of the error bands. Multiple price predictions are calculated using different combinations of parameters a, b, and c.
math.pow(): A built-in Pine Script function that calculates exponentiation. For example, math.pow(x, y) calculates x raised to the power of y.
math.exp(): A built-in Pine Script function that calculates the exponential function (e raised to the power of a number). For example, math.exp(x) calculates e raised to the power of x.
Mathematical and Algorithmic Background
This calculation formula combines two elements: the limited growth model and the stock-to-flow model.
Limited Growth Model
* **Calculation of w and r:** w = a \* math.pow((3.64568 \* 1000000), b) and r = -math.pow(2, e) represent the idea that the rate of increase in Bitcoin's value gradually diminishes over time (limited growth).
* **Calculation of w:** w is a coefficient that changes over time (represented by the constant 3.64568 \* 1000000, which is said to depend on the number of blocks) and is calculated using parameters a and b, which are estimated by fitting to past price data.
* **Calculation of e and r:** e = -0.0000047619 \* b \* h and r = -math.pow(2, e) take into account Bitcoin's halving events and represent the adjustment of the rate of increase in value as the number of blocks h progresses. In particular, r models the effect of the reduction in mining rewards due to halvings on the price using an exponential function. 0.0000047619 is a coefficient estimated from past data that adjusts the diminishing effect of the increase in value over time.
Stock-to-Flow Model
* **Calculation of t:** t = math.pow(s, -b) is based on the core concept of the stock-to-flow model and represents the impact of Bitcoin's scarcity on its value.
* **Stock (s) and Flow:** s represents the total supply of Bitcoin (stock).
* **Relationship between Scarcity and Value:** t is calculated as s raised to the power of -b, and the relationship is modeled such that as the supply decreases (scarcity increases), the value of t increases, resulting in an increase in the predicted price p. The coefficient b is a value estimated from past data analysis and represents the strength of the relationship between scarcity and value.
Calculation of Predicted Price
* **p = (1/s) \* (c \* math.exp(w \* r \* t)):** This formula calculates the final predicted price p by the LG-S2F model, multiplying the inverse of the supply s (scarcity) by the limited growth model part (c \* math.exp(w \* r \* t)).
* **c:** A constant term that adjusts the overall scale of the model. It is estimated by fitting to past price data (e.g., 81.000 \* 1000000000000).
* **math.exp(w \* r \* t):** This exponential function part represents limited growth over time. w, r, and t are variables representing the passage of time, the effect of halvings, and the effect of scarcity, respectively, and their interaction models the long-term growth pattern of Bitcoin's price.
Calculation of Error Bands
* **p1a, p1b, ..., p2c:** These variables are used to calculate the upper and lower limits of the error bands.
* **Variation of Parameters:** Multiple price predictions are calculated using values obtained by adding or subtracting variations based on their respective standard errors to or from the estimated values of parameters a, b, and c.
* **Range of Uncertainty:** From these multiple price predictions, the possible range of the predicted value (error band) is calculated. This allows for a quantitative evaluation and visualization of the uncertainty in the model prediction.
Summary
Through the monthly chart analysis of the LG-S2F model, we have reaffirmed that there are clear patterns that have been repeated in the past in the long-term price fluctuations of Bitcoin (BTC).
Current Price and Upper Resistance Band:
As of January 2025, the price of BTCUSD is around $104,278, which is near the upper error band. Considering past patterns, a short-term adjustment phase is likely.
Mid-Term Scenario:
For the mid-term price movement, the most likely scenario is the formation of a range-bound market between the upper error band and the predicted price. The lower error band will continue to function as a strong support line, while the upper error band will continue to be recognized as a strong resistance zone.
Risk of a Major Crash is Limited:
Since the lower error band has functioned as a strong support zone multiple times in the past, the risk of a sudden, major crash is considered to be limited compared to the past.
Long-Term Perspective:
In the long term, Bitcoin's value is expected to rise based on its scarcity, but this growth is expected to gradually become more limited.
However, overconfidence is dangerous. The LG-S2F model is a statistical model based on past data and cannot perfectly predict the future. Changes in external environments, such as changes in monetary policy, increased regulations, and technological innovations, can significantly distort predictions.
Reaching New Heights: Take Your Trading to the Next Level with AlgoAlpha
From the analysis so far, you should understand that the LG-S2F model is an effective tool for long-term BTC prediction.
However, this is just one example of the many tools offered by AlgoAlpha .
The true value of AlgoAlpha lies in the advanced analytical tools, comparable to those used by institutional investors, that are unlocked with a paid plan.
Sophisticated Analytical Tools:
Utilize Momentum Concepts™, Smart Signals Assistant™, ILPAC™, and more to gain a deep understanding of market movements.
Market Analysis Reports by Experts:
Detailed explanations in English of the latest trends, notable coins, and risk factors. Support your decision-making with a global perspective and deep insights.
Furthermore, when you sign up for a paid plan, you can use the referral code below to receive special benefits.
Partner Link: www.algoalpha.io
Referral Code: obljltsz
Disclaimer: This analysis is for informational purposes only and does not constitute investment advice. Investing in cryptocurrencies, including Bitcoin, carries a high risk of price fluctuations and the potential for loss of principal. Investment decisions should always be made under your own responsibility. The information presented in this analysis is based on past data and a specific model, and does not guarantee future price movements. The author assumes no responsibility for any damages incurred based on this analysis.

ビットコイン(BTC)の将来価格予測:LG-S2Fモデルに基づくテクニカル分析データとロジックで導く、勝利へのシナリオ
皆様、こんにちは。アルゴリズムトレーダーの FibonacciFlux です。
私は、世界中のトレーダーが愛用するプラットフォーム「TradingView」上で、
機関投資家レベルの高度な分析ツールを提供する AlgoAlpha のパートナーとして活動しています。
ビットコイン(BTC)投資において、
皆様はどのような指標を参考にされていますか?
移動平均線、RSI、MACD…様々なテクニカル指標がありますが、
今回は、長期的な価格予測 に役立つ
「限定成長ストック・トゥ・フローモデル(LG-S2F)」
を用いて、足元のBTCの値動きを分析し、
中長期的な未来を読み解いていきます。
この分析では、まずLG-S2Fモデルの概要を解説し、
次に月足チャートを用いたテクニカル分析を行います。
その後、2024年以降のBTC価格のシナリオを3つ提示し、
それぞれの可能性について考察します。
「専門用語が多くて難しそう…」 と思われるかもしれません。
しかし、安心してください。
ここでは、難しい専門用語も、一般的になじみのある言葉を選び、
例え話を交えながら、分かりやすく解説していきます。
さらに、明確な利益目標と損切エリア を提示することで、
具体的なトレードアイデアを明確にします。
この分析を通じて、BTCの長期的な価格動向を理解し、
皆様の投資戦略の精度向上に貢献できれば幸いです。
LG-S2Fモデルとは?:希少性が織りなす、価値の物語
ストック・トゥ・フロー(S2F)モデル:金(ゴールド)との類似性
まず、ストック・トゥ・フロー(S2F)モデル について簡単に説明します。
これは、資産の希少性 を数値化し、その価値を測るモデルです。
イメージとしては、金(ゴールド) を思い浮かべてください。
ストック(Stock): 地球上に既に存在する金の総量(例:オリンピックプール約4杯分)
フロー(Flow): 1年間に新たに採掘される金の量(例:オリンピックプールの約1/10杯分)
金のストックは膨大ですが、フローは限られています。
つまり、金は希少性が高い ということです。
この希少性こそが、金の価値を支えているのです。
S2Fモデルでは、
この ストックをフローで割った値(S2F比率) を用いて、
資産の希少性を数値化します。
S2F比率 = ストック ÷ フロー
例えば、金のS2F比率は約60です。
これは、現在のペースで採掘を続けると、
地球上の金の総量に追いつくまでに約60年かかることを意味します。
ビットコインのS2F比率:デジタル・ゴールドの価値創造
ビットコインも金と同様に、供給量に上限(2100万BTC) があります。
さらに、約4年に一度の「半減期」 によって、
新規発行量(フロー)が半分になります。
つまり、ビットコインのS2F比率は、
時間とともにどんどん大きくなり、希少性が高まっていく のです。
限定成長S2F(LG-S2F)モデル:現実世界への適応
従来のS2Fモデルは、
S2F比率と価格が直線的な関係にあると仮定していました。
しかし、現実には、価格の上昇には限界があります。
そこで登場するのが、LG-S2Fモデル です。
これは、従来のS2Fモデルに 「限定成長」 の概念を加え、
時間経過による価値の増加率が逓減していく(徐々に成長が鈍化していく)
様子を表現した、より現実に即したモデルです。
さらに、LG-S2Fモデルは、
統計的な誤差範囲(エラーバンド) を表示することで、
予測の不確実性を視覚化しています。
AlgoAlphaのLG-S2Fモデル は、
これらの理論に基づき、ビットコインの長期的な価格予測を可能にしています。
月足チャート分析:過去の足跡から未来の道筋を探る
それでは、実際に AlgoAlphaのLG-S2Fモデル を用いて、
ビットコインの月足チャートを分析してみましょう。
使用チャート:BTC/USD 月足チャート(BITSTAMP)
表示期間:2012年から現在(2025年1月)
チャートの構成要素:
ローソク足: ビットコインの月ごとの価格変動を表します。
予想価格(灰色線): LG-S2Fモデルが予測するビットコインの理論価格。
上部エラーバンド(赤系統): 過去のデータから算出した、価格変動の上限範囲。強い抵抗帯として機能しやすい領域です。
下部エラーバンド(緑系統): 過去のデータから算出した、価格変動の下限範囲。強い支持帯として機能しやすい領域です。
現在の価格:約104,278ドル(2025年1月時点)
抵抗帯と支持帯:歴史が語る値動きのパターン
過去のチャートを見ると、
上部エラーバンドと下部エラーバンドが、
それぞれ抵抗帯と支持帯 として機能してきたことが分かります。
抵抗帯(上部エラーバンド): 価格がこの領域に到達すると、売り圧力が高まり、調整や下落が起こりやすい傾向があります。
支持帯(下部エラーバンド): 価格がこの領域に到達すると、買い圧力が高まり、反発や上昇が起こりやすい傾向があります。
例:
2013年、2017年、2021年: 価格は上部エラーバンドに到達した後、大きく下落しました。
2015年、2018年、2022年: 価格は下部エラーバンドで反発し、上昇トレンドに転換しました。
上部エラーバンド:越えられない壁か?
注目すべきポイント: 過去の月足チャートにおいて、ビットコインの価格が上部エラーバンドを明確に上抜けて、その水準を維持したことは一度もありません。
最新の状況(2025年1月):
提供された最新チャートを見ると、
2025年1月の月足は長い上ヒゲを付け、
上部エラーバンド付近で強い抵抗を受けている ことが確認できます。
考察: 2025年1月の値動きは、過去数回と異なり、
上部バンドを明確に上抜けることなく、
長い上ヒゲで抵抗を受けている 様子が確認できます。
これは、上部エラーバンドがこれまで以上に強力な抵抗帯として
機能していることを示唆しています。
下部エラーバンド:大暴落リスクは?
一方、下部エラーバンドは、
過去複数回にわたって支持帯として機能してきました。
このことから、ビットコイン価格が突然、
大幅に下落するリスクは比較的小さいと考えられます。
ただし、2014年後半~2015年、2018年後半のように、
下部エラーバンドを明確に下抜けた場合は、
長期的な弱気相場の始まりとなる可能性 があります。
そのため、この水準を下抜ける動きには最大限の警戒が必要です。
シナリオ分析:2025年以降のBTC価格を予測
以上の分析を踏まえ、
2025年以降のビットコイン価格のシナリオを3つ考えてみましょう。
思考過程:
大局観の把握:
ビットコインは供給量が限定されている。
過去、半減期後に価格が大きく上昇してきた。
これらの事実から、長期的には上昇トレンドが続くと仮定できる。
LG-S2Fモデルの予測をベースにする:
モデルは、価格が時間とともに限定的に成長し、
一定の範囲(エラーバンド)内で推移することを示唆している。
過去のパターンを参考にする:
上部エラーバンドは強い抵抗帯、
下部エラーバンドは強い支持帯として機能してきた。
直近の値動きを重視する:
2024年3月、そして2025年1月現在は、
上部エラーバンド付近で上ヒゲを付けており、抵抗を受けている。
外部要因を考慮する: 金融政策、規制、技術革新など、
ビットコイン価格に影響を与えうる要因を考慮する。
シナリオ1:レンジ相場形成(可能性:高)
短期(2025年内):
現在の価格(約104,278ドル)は上部エラーバンド付近に位置するため、
上値は重い と予想されます。
上部エラーバンドと予想価格(約70,000〜110,000ドル付近)の間で
レンジ相場 を形成する可能性が高いです。
中期(2026年~2028年頃):
対数スケールで70,000~110,000ドル付近 でのレンジ相場が継続。
下部エラーバンドは引き続き強力な サポートライン として機能し、
大幅な下落は回避されると予想されます。
トレードアイデア:
利益目標: 110,000ドル付近(レンジ上限、上部エラーバンド付近)
損切エリア: 68,000ドル付近(予想価格およびレンジ下限)
戦略:
下部エラーバンド付近(70,000ドル付近)で買い、
上部エラーバンド付近(110,000ドル付近)で売る、レンジ逆張り戦略。
予想価格付近(70,000〜110,000ドル)でのレンジ相場形成を確認後、
レンジ上限・下限付近での逆張り。
思考過程:
最も可能性が高いと考えるシナリオです。
上部エラーバンドが強力な抵抗帯 となっており、
過去のパターンから、短期間でこれを上抜ける可能性は低いと判断しました。
下部エラーバンドは強力な支持帯 として機能しているため、
大幅な下落のリスクは小さいと考えられます。
レンジ相場を想定し、レンジ上限と下限を利益目標と損切エリア に設定しました。
シナリオ2:強気相場再開(可能性:中)
短期(2025年内):
上部エラーバンドが抵抗となり、調整局面 に入る可能性。
中期(2026年~2028年頃):
次の半減期や機関投資家の参入増加、ビットコイン関連技術の進歩などの好材料。
レンジ相場を形成後、再び上昇トレンドに転じ、
上部エラーバンドを明確に上抜ける可能性も。
過去最高値である約70,000ドル、さらに節目となる100,000ドル、
そして次の上部バンド付近である150,000ドル、
200,000ドルを目指す展開も考えられます。
過去の推移を見ても上部バンドの抵抗は強く、
上抜ける為には相当な上昇圧力が必要。
トレードアイデア:
利益目標: 150,000ドル、200,000ドル(過去最高値、キリ番、次の上部バンド)
損切エリア: 68,000ドル付近(レンジ下限)
戦略:
上部エラーバンド付近では、一旦利益確定売り。
押し目買いを狙う場合、予想価格付近(70,000ドル〜110,000ドル)や
下部エラーバンド付近が候補。
上部エラーバンドを明確に上抜けた場合は、
損切ラインを引き上げつつ、上昇トレンドに乗る。
思考過程:
可能性は中程度と判断しました。
次の半減期 や 機関投資家の参入 など、上昇要因は存在します。
しかし、上部エラーバンドの抵抗は非常に強く、
過去にこれを明確に上抜けたことはないため、慎重な姿勢が必要です。
レンジ相場を前提としつつ、上抜けた場合に備える
という戦略が有効と考えられます。
シナリオ3:弱気相場への転落(可能性:極めて低)
短期(2025年内):
上部エラーバンドが抵抗となり、調整局面 に入る可能性。
中期(2026年~2028年頃):
主要国による規制強化、ビットコインの致命的な技術的欠陥の露呈、
より優れた機能を持つ暗号資産の台頭などの悪材料。
投資家心理が冷え込み、予想価格、
さらに下部エラーバンドを割り込む可能性も。
長期的な弱気相場に突入し、
対数スケールで10,000ドル以下 を目指す展開も想定されます。
しかし、2015年、2018年、そして2022年と、
下部エラーバンドは強力な支持帯として機能してきた経緯があり、
この シナリオの可能性は極めて低い と見ています。
トレードアイデア:
利益目標: 68,000ドル付近(予想価格)、40,000ドル付近(下部エラーバンド付近)
損切エリア: 110,000ドル(直近高値)、150,000ドル(上部エラーバンド)
戦略:
上部エラーバンド付近は戻り売りの好機。
予想価格や下部エラーバンド付近で下げ止まるか注視。
下部エラーバンドを明確に下抜けた場合は、
損切を徹底し、弱気相場に備える。
思考過程:
可能性は極めて低いと判断しました。
下部エラーバンドが強力な支持帯 として機能してきた実績があります。
ビットコインの技術的優位性や、ネットワーク効果 を考慮すると、
長期的に価値がゼロになる可能性は低いと考えられます。
ただし、投資にはリスクがつきもの です。
万が一、弱気相場に突入した場合に備え、
損切ラインの設定などのリスク管理は徹底する必要があります。
コード解説:数学的・アルゴリズム的詳細
以下、コードの主要部分について、
数学的およびアルゴリズム的な観点から、詳細な解説を行います。
データ取得:BTC供給量とブロック高 s = request.security("BTC_SUPPLY", "D", close) h = request.security("BTC_BLOCKS", "D", close)
request.security() 関数: 指定した銘柄のヒストリカルデータを取得するための
Pine Script 組み込み関数です。
"BTC_SUPPLY": ビットコインの総供給量データを取得するためのティッカーシンボルです。
"BTC_BLOCKS": ビットコインのブロック高(生成されたブロックの総数)
データを取得するためのティッカーシンボルです。
"D": データ取得の時間軸を日足(Daily)に指定しています。
close: 取得する価格データを終値(Close Price)に指定しています。
ビットコイン供給量 (s):
ビットコインの総供給量は、
マイニング報酬の半減期に基づいたアルゴリズムによってプログラムで決定されます。
約4年ごとに発生する半減期イベントで、マイナーに支払われる報酬が半分になります。
この供給量データは、LG-S2Fモデルにおける 「ストック」を構成する重要な要素 です。
ブロック高 (h):
ブロック高は、ビットコインのブロックチェーンが
生成開始されてからのブロックの総数を表します。
ブロックは約10分に1回の頻度で生成されるため、
ブロック高は時間経過とともに増加し続けます。
ブロック高は、半減期のタイミングを正確に決定するために使用され、
間接的にビットコインの供給量、つまり 「フロー」に影響を与えます 。
ae1 = 0.17/2
ae2 = 0.17
ae3 = 0.17*(3.0/2)
be1 = 0.02/2
be2 = 0.02
be3 = 0.02*(3.0/2)
ce1 = (22.71000000000000)/2
ce2 = 22.71000000000000
ce3 = (22.71000000000000)(3.0/2)
コードの概要
このコード部分は、LG-S2Fモデルの予測精度を評価し、
信頼区間を視覚化するために不可欠な「エラーバンド」を
算出するための係数を定義しています。
ここでは、モデルの主要パラメータである a, b, c と、
それらに対応する標準誤差を用いて、
エラーバンドの上限および下限を計算するための準備を行っています。
パラメータの詳細
LG-S2Fモデルを構成する数式の中核をなす係数です。
これらの値は、過去のビットコイン価格データとストック・トゥ・フロー比率を基に、
統計的手法(例:回帰分析)を用いて推定されます。
これらのパラメータはモデルの形状、
すなわちビットコイン価格予測の軌道を決定づける重要な役割を果たします。
a: 価格予測の基準となるスケーリング係数。モデルの全体的な高さを調整します。
b: 時間経過による成長の逓減効果を表す係数。
この値が大きいほど、成長の鈍化が急激になります。
c: ストック・トゥ・フロー比率と価格との関係を調整する係数。
ae1, ae2, ae3, be1, be2, be3, ce1, ce2, ce3: これらは、
それぞれパラメータ a, b, c の標準誤差に関連する値であり、
各パラメータの推定における不確実性(誤差)の大きさを表します。
これらの値は、a, b, c の推定値がどの程度信頼できるかを示す指標となります。
標準誤差の算出: これらの値は、過去のデータを用いた回帰分析などから導き出されます。
例えば、0.17, 0.02, 22.7*1000000000000 といった具体的な数値は、
過去のビットコイン価格とストック・トゥ・フローのデータセットに対する
統計的フィッティングから得られた結果を反映しています。
これらの数値は、
データセットの大きさ、データのばらつき、モデルの複雑さなど、
多くの要因によって影響を受けます。
ae1 = 0.17/2, be1 = 0.02/2, ce1 = (22.7*1000000000000)/2 のように、
一部の値が2で割られているのは、エラーバンドを算出する際に、
標準誤差を中心として上下にどの程度広げるかを決めるための調整です。
多くの場合、標準誤差の数倍(例えば、1倍、2倍、3倍)を
上下の幅としてエラーバンドを描画します。
a1a, a1b, a1c, a2a, a2b, a2c, b1a, ..., c2c: これらの変数は、
パラメータ a, b, c に、それぞれの標準誤差に関連する変動量を
加算または減算することで算出されます。
これらの変数は、エラーバンドの上限値と下限値を計算する際に使用され、
モデル予測における不確実性の範囲を定義します。
例:a1a = a + ae1: これは、パラメータ a の推定値に、
その標準誤差に関連する変動量 ae1 を加算することで、
a の値が取りうる上限を計算しています。
エラーバンドへの適用: これらの変数を用いて、
パラメータの異なる組み合わせを複数作成し、
それぞれの組み合わせで価格予測を計算します。
これにより、パラメータの推定誤差が価格予測に与える影響の範囲を評価し、
エラーバンドとして視覚化することが可能になります。
数学的・アルゴリズム的背景
誤差伝播:
このコードの背後にある重要な概念は「誤差伝播」です。
モデルのパラメータ推定における誤差が、
最終的な予測値(この場合はビットコインの価格)に
どのように影響するかを定量化する統計学的手法です。
信頼区間の推定:
誤差伝播の考え方を用いて、
モデルによる予測値の信頼区間(エラーバンド)を推定します。
これにより、予測値の不確実性を考慮した、
より現実的な価格予測の範囲を提示することができます。
線形近似:
a1a = a + ae1 のような計算は、
誤差伝播を簡略的に計算するための線形近似に基づいています。
このアプローチは計算が容易であるというメリットがありますが、
モデルが非線形である場合、
より高次の項まで考慮した非線形誤差伝播の適用が望ましい場合もあります。
p = (1/s)(cmath.exp(wrt))
p1a = (1/s)(c1amath.exp(w1ar1at1a))
p1b = (1/s)(c1bmath.exp(w1br1bt1b))
p1c = (1/s)(c1cmath.exp(w1cr1ct1c))
p2a = (1/s)(c2amath.exp(w2ar2at2a))
p2b = (1/s)(c2bmath.exp(w2br2bt2b))
p2c = (1/s)(c2cmath.exp(w2cr2ct2c))
コードの概要
この部分は、LG-S2Fモデルの核となる価格予測値を計算する部分であり、
限定成長モデルとストック・トゥ・フローモデルの要素が組み合わされています。
変数の解説
w, e, r, t: これらは、最終的な価格予測値 p を算出するための中間変数であり、
計算式を簡潔に記述するために導入されています。
p: LG-S2Fモデルが予測するビットコインの理論価格(予測中心値)を計算するための変数です。
p1a, p1b, p1c, p2a, p2b, p2c: これらは、
エラーバンドの上限値と下限値を計算するための変数です。
パラメータ a, b, c の異なる組み合わせを用いて、複数の価格予測値を算出します。
math.pow(): べき乗を計算するPine Scriptの組み込み関数です。
例えば、math.pow(x, y) は x の y 乗を計算します。
math.exp(): 自然対数の底 e のべき乗(指数関数)を計算するPine Scriptの組み込み関数です。例えば、math.exp(x) は e の x 乗を計算します。
数学的・アルゴリズム的背景
この計算式は、
限定成長モデルとストック・トゥ・フローモデルの2つの要素を組み合わせたものです。
限定成長モデル
w と r の計算部分: w = a * math.pow((3.64568 * 1000000), b) と r = -math.pow(2, e) は、
時間経過に伴うビットコインの価値の増加率が徐々に逓減していく(限定的な成長)
という考え方を表しています。
w の計算: w は、時間経過(ブロック数に依存するとされる定数 3.64568 * 1000000 で表現)
によって変化する係数であり、
過去の価格データへのフィッティングによって
推定されたパラメータ a と b を用いて計算されます。
e と r の計算: e = -0.0000047619 * b * h と r = -math.pow(2, e) は、
ビットコインの半減期イベントを考慮し、
ブロック数 h の経過に伴う価値増加率の調整を表現しています。
特に、r は半減期によるマイニング報酬の減少が価格に与える影響を、
指数関数を用いてモデル化しています。
0.0000047619 は、過去データから推定された、
時間経過による価値増加の逓減効果を調整する係数です。
ストック・トゥ・フローモデル
t の計算部分: t = math.pow(s, -b) は、
ストック・トゥ・フローモデルの核心的な考え方に基づき、
ビットコインの希少性が価値に与える影響を表現しています。
ストック(s)とフロー: s はビットコインの総供給量(ストック)を表します。
希少性と価値の関係: t は供給量 s の -b 乗として計算され、
供給量が減少するほど(希少性が高まるほど)、t の値が大きくなり、
結果として価格予測値 p が上昇する関係がモデル化されています。
係数 b は、過去のデータ分析から推定された値であり、
希少性と価値の関係の強さを表します。
価格予測値の計算
p = (1/s) * (c * math.exp(w * r * t)): この式は、LG-S2Fモデルによる
最終的な価格予測値 p を計算するものであり、
供給量 s の逆数(希少性)と、限定成長モデル部分 (c * math.exp(w * r * t)) を乗算します。
c: モデル全体のスケールを調整する定数項です。
過去の価格データへのフィッティングによって推定されます(例:81.000 * 1000000000000)。
math.exp(w * r * t): この指数関数部分は、時間経過に伴う限定的な成長を表現しています。
w, r, t はそれぞれ、時間経過、半減期の影響、希少性の効果を表す変数であり、
これらの相互作用によって、ビットコイン価格の長期的な成長パターンがモデル化されます。
エラーバンドの算出
p1a, p1b, ..., p2c: これらの変数は、
エラーバンドの上限と下限を計算するために使用されます。
パラメータの変動: パラメータ a, b, c の推定値に、
それぞれの標準誤差に基づく変動量を加算または減算した値を用いて、
複数の価格予測値を計算します。
不確実性の範囲: これらの複数の価格予測値から、
予測値の取りうる範囲(エラーバンド)が算出されます。
これにより、モデル予測における不確実性を定量的に評価し、
視覚化することが可能になります。
まとめ
LG-S2Fモデルの月足チャート分析を通じて、
ビットコイン(BTC)の長期的な価格変動には、
過去から繰り返されてきた明確なパターンが存在することが改めて確認できました。
現在価格と上部抵抗帯:
2025年1月現在、BTCUSDの価格は約104,278ドルと、
上部エラーバンド付近に位置しており、
過去のパターンを考慮すると、短期的には調整局面に入る可能性が高いと考えられます。
中期的なシナリオ:
中期的な価格推移としては、
上部エラーバンドと予想価格の間でレンジ相場を形成するシナリオが
最も可能性が高いと見ています。
下部エラーバンドは引き続き強力なサポートラインとして機能する一方、
上部エラーバンドは依然として強固な抵抗帯として意識されるでしょう。
大暴落リスクは限定的:
下部エラーバンドが過去複数回にわたり強固な支持帯として機能していることから、
急激な大暴落のリスクは過去と比較して限定的になっていると考えられます。
長期的な視点:
長期的に見ると、ビットコインの希少性に基づく価値の上昇が期待されますが、
その成長は徐々に限定的になっていくと予想されます。
ただし、過信は禁物です。LG-S2Fモデルは過去のデータに基づいた統計モデルであり、
未来を完全に予測することはできません。
金融政策の変更、規制強化、技術的革新など、
外部環境の変化は予測を大きく狂わせる可能性があります。
さらなる高みへ:AlgoAlphaであなたのトレードを次のレベルへ
これまでの分析で、LG-S2FモデルがBTC長期予測に有効なツールであることは
ご理解いただけたと思います。
しかし、これは AlgoAlpha が提供するツール群の、ほんの一例に過ぎません。
AlgoAlphaの真価は、有料プランで解放される、
機関投資家レベルの高度な分析ツール群にあります。
洗練された分析ツール:
Momentum Concepts™、Smart Signals Assistant™、ILPAC™などを駆使し、
市場の深層を読み解くことが可能に。
専門家による市場分析レポート:
最新トレンド、注目コイン、リスク要因などを日本語で詳細に解説。
グローバルな視点と深い洞察で、あなたの意思決定をサポート。
さらに、有料プランへご登録の際は、以下のリファラルコードをご利用いただくと、
特別な特典が適用されます。
パートナーリンク: www.algoalpha.io
リファラルコード: obljltsz
免責事項:この分析は、情報提供のみを目的としており、投資助言を行うものではありません。ビットコインを含む暗号資産への投資は、価格変動リスクが高く、元本を失う可能性があります。投資判断は、必ずご自身の責任において行ってください。本分析で提示される情報は、過去のデータと特定のモデルに基づいた分析であり、将来の価格変動を保証するものではありません。本分析に基づいて発生したいかなる損害についても、筆者は一切の責任を負いません。

本日のビットコイン1/19(日)#2
先ほど投稿した内容と目線が変わります。
SMAの向きが上向きなので、ロング目線で考えて画像のようなライン引きになります。
ブルーの切り下げチャネルを上抜けて、ダブルボトムの形で上昇を見せていくことになりそうです。
ということで、ここからは、目線を変えてみていきたいと思います。

本日のビットコイン1/19(日)#1
1. 現状の価格動向
ビットコインは、ブルーのチャネルを下抜ける動きを見せており、下落トレンドの兆候が強まっています。短期的なテクニカル要因からも、この流れが継続する可能性が高い状況です。
2. エントリー条件
ショートエントリーを検討する際のトリガーとしては、20SMAの傾きがブルーのチャネル割れを確認したタイミングがポイントとなります。この条件を満たした場合、さらなる下落への順張りが有効です。
3. 利確ポイント
決済の目標値は、ブラックのチャネル下限を基準に設定します。このエリアは強力なサポートゾーンとなる可能性があり、下落の一旦の止まりどころとして意識されます。
4. 総括
ビットコインは、ブルーのチャネルを下抜け、弱気の動きが鮮明になりつつあります。20SMAの傾きがチャネル割れを確認した際にショートポジションを取ることで、リスクを抑えながらトレンドに追随する戦略が有効です。利確ポイントはブラックのチャネル下限を目安に、慎重な取引を心がけることが重要です。

本日のビットコイン1/18(土)#1
1. 日中の値動き
本日、ビットコインはブルーのチャネル内で三尊を形成し、それがトリガーとなって下落しました。その後、ブラックの決済チャネルの下限まで到達し、ここで反発の動きが見られました。
2. 現在の状況
反発後、ビットコインはパープルのライン上で逆三尊を形成し、トレンド転換を示唆する動きが出ています。現時点では、ネックラインを上抜けた段階にあり、さらなる上昇の可能性が注目されています。
3. 今後の戦略
•ロングエントリーのタイミング: ネックラインまでの値下がりを確認後、リテストで反発が見られた場合はロングエントリーを検討します。
•様子見の条件: ネックラインを再び下抜けた場合は、明確なトレンドが確認できるまでエントリーを控え、様子見を推奨します。
4. 総括
ビットコインは、日中の三尊形成からの下落を経て、現在は逆三尊のネックラインを上抜ける局面にあります。今後は、ネックラインでのリテスト結果を確認し、反発による上昇が見られればロングポジションを検討する形が有効です。一方、ネックラインを下抜ける場合は、さらなる値動きを観察し、冷静に次の展開を判断する必要があります。

BTCUSD 1月16日ビットコインBybitチャート分析です。こんにちは
ビットコインガイドです。
「フォロワー」をしておけば
リアルタイムの移動経路や主要区間からコメント通知を受け取ることができます。
私の分析が役立つ場合
下部にブースターボタン一つずつお願いします。
ビットコインの30分チャートです。
しばらくして10時30分、ナスダックの指標発表があります。
3時間チャートMACDデッドクロスプレスがある場所で
リアルタイムでナスダックは垂直上昇の可能性があります。
テザードミナンスでは現在の場所で垂直下落の可能性があります。
今週見てご存じですが、
じっと口を開けているが11,000不程度上昇しましたね?
キャンドルの形とか苛性雨で見たとき
入り口を見逃すこともあり、手節が短くなります。
積極的に運営しました。
*赤い指の移動経路
ワンウェイロングポジション戦略
1. 98982火災追撃枚数/紫色支持線完全離脱時
または2番区間をタッチすると
2. Top区間 101883.5火 1次ターゲット -> Good 2次ターゲット
今日予想していた支持ラインを先にタッチ中だから勝負を見ようとします。
上部に紫の指99.7Kは今日のベストショットポジション入り口です。
2番区間はボリンジャーバンド2時間チャート中央線タッチ区間であるため
短期パターンが壊れる可能性があるので、それは紫色の支持線から上げることができます。
ロングポジションの立場で最高です。
1番2番区間収束区間は横保障
3番区間は1+4メジャー支持ラインになります。
ここまで、
原則売買、手折が必須で安全に運営していただきたいと思います。
ありがとうございます。

本日のビットコイン1/16(木)#1
1. 現状の価格動向
ビットコインは、ブルーのラインを下抜けた状態にあり、全体として下落トレンドが継続しています。短期的な動向を見ると、SMAも下向きに推移しており、弱気の相場が続いていることを示しています。
2. サポートラインの状況
現在、パープルのラインがサポートラインとして機能していますが、反発力は弱く、下方へのブレイクが懸念される局面です。仮にパープルのラインを下抜けた場合、さらなる下落が進行し、ブラックの決済チャネルの下限を目指す動きになる可能性が高いと見ています。
3. エントリー戦略
今後エントリーを検討する場合、パープルのラインを下抜けたタイミングが有効なトリガーとなります。このポイントでのエントリーは、下落トレンドへの順張り戦略として理にかなっています。
4. リスク管理と利確方針
•利確ポイント: 98,000ドル付近を目標とし、ブラックの決済チャネルの下限までの値幅を狙います。
•損切りポイント: パープルのラインの内側に価格が戻ってきた場合を損切りの基準とします。この基準を明確にすることでリスクを限定します。
5. 総括
ビットコインは、ブルーのラインを下抜け、弱気相場が進行している状況です。パープルのラインがサポートとして機能しているものの、反発力の弱さが目立ち、下方ブレイクの可能性が高まっています。エントリーの際は、明確なトリガーを確認しつつ、利確と損切りのポイントを明確にした慎重な取引が重要です。

BTCUSD 1月14日ビットコインBybitチャート分析です。こんにちは
ビットコインガイドです。
「フォロワー」をしておけば
リアルタイムの移動経路や主要区間からコメント通知を受け取ることができます。
私の分析が役立つ場合
下部にブースターボタン一つずつお願いします。
ビットコインの30分チャートです。
しばらくして10時30分にナスダック指標発表があります。
ビットコインは
12時間+日棒チャートMACDゴールデンクロスが進行中ですが
ボリンジャーバンド12時間
ナスダックに気づいています。
*赤い指の移動経路
ワンウェイロングポジション戦略
1. 95811.5火 ロングポジション入口区間 / 紫色支持線離脱時または
Bottom区間タッチ時の手節
2. 99966.5ブルロングポジション1次ターゲット -> Good -> Great順にターゲットが
上部に紫色の指で
1番区間を表示しました。
ナスダックから調整が出ると計算したため
ビットが最初に1番の区間に触れると
今日の戦略に成功する可能性が高くなります。
1番区間手節がとり、自律ショートポジション運営区間です。
戦略に成功した場合、明日の後にロングポジションの再進入区間
活用してもいいです。
上部に1番オレンジ色の抵抗線と
下部にボトムスカイブルーの支持線収束区間は横歩区間です。
また、現在の席はボリンジャーバンド12時間チャート、一峰チャート中央線に
キャンドルが突破を進行中です。
最初ではなく2番目のタッチなので
上昇傾向を予想し、
トップに目標を置いた理由は
一峰チャートからキャンドル一つが中央線→抵抗線まで
一度にタッチは難しいからです。
最後に
現在のビットとテザードミナンスの場合
5分棒チャート支持線や抵抗線に触れなかったため
テザードミナンスの垂直下落に応じて
ビットコイン12時間+日棒チャートMACDゴールデンクロスが刻印されて
垂直上昇に勝負をかけました。
今日もナスダックの動きが重要です。
ここまで、
原則売買、手折が必須で安全に運営していただきたいと思います。
ありがとうございます。

ビットコインは平均採掘コストの92552で下落が止まるビットコインはリップルと違いマイニング業者(マイナー)がいるため平均採掘コスト(Average Mining Costs)に注視する必要があります。このAMCから価格が乖離するとマイナーは先物で売りを入れてきますし、AMCに近づくと在庫を吐き出さなくなります。
最近ではビットコインETFなど投資信託を発行する人たちもマイニング業者からビットコインを貸し借りすることで相場に影響を与えてくるようになりました。
とはいえAMCの価格はマイナーの損益分岐点でもありますからとても重要ですし、AMCは基本的に上昇傾向であるものの日々変動しますので週に1度はMacroMicroなどのサイトでチェックすることをおすすめいたします。

【FXドル円】指標発表前の相場!対策は?CPIの発表を前にして相場は髭をつけながらも方向感に乏しい展開。
方向感がないので、高値圏での順張りはリスクが高い。
初心者にも分かりやすく解説しました。#FX初心者

BTCUSD 1月13日ビットコインBybitチャート分析です。こんにちは
ビットコインガイドです。
「フォロワー」をしておけば
リアルタイムの移動経路や主要区間からコメント通知を受け取ることができます。
私の分析が役立つ場合
下部にブースターボタン一つずつお願いします。
ナスダック30分チャートです。
今日別に指標発表はありません。
一峰支持+周峰中央線上昇パターンに従う
下段に20.4Kロングポジションに入るか切り替えに勝負をかけました。
入り口のタッチなしでポールを横断する可能性もあります。
20.4K付近の主棒チャート中央線をタッチするか
必ずチェックしてください。
そのままビットコインに代入しました。
ビットコインの30分チャートです。
午前94.5Kギャップを元に戻した後
4+6 MACDデッドクロス進行中
ナスダックとは違って強く垂直下落中です。
現状では、主棒チャートMACDデッドクロス以外
特に危険信号はありません。
ボリンジャーバンド6時間チャート抵抗線->6時間チャート支持線タッチ中です。
*空色指移動経路
双方向ニュートラル
ショート->ロングスイッチング戦略です。
1. 92764.5火ショートポジション入口区間 / オレンジ色抵抗線突破時手節街
2. 91217火 ロングポジションスイッチング / 紫色支持線離脱時の手折り
3. 93.4Kロングポジション 1次ターゲット -> Top 2次ターゲット以降、順番にターゲットが
分析記事の作成中にリアルタイムでロングポジションスイッチング位置
91.2Kタッチが行われたので参考にしてください。
簡単に説明すると、ナスダックの動きに応じて
水色指91.2Kロングか下段に1回89.Kロングか
どちらか一つになると思います。
今日、最終6時間チャートの支持線をタッチしながら下落傾向にあります。
下段に1番区間は12時間、一棒チャート支持線タッチ位置です。
ここの区間のタッチからは下が開いています。
引き続き強く下落傾向が
つながる可能性があるため、ロングポジションの立場では注意が必要です。
先週残した9日の分析文と同様の状況が進行中です。
上部に水色の指92.7Kショートエントリータッチなし
91.2Kを最初にタッチする場合
すぐにロングポジションに入るよりも
上部にショートポジション入り口をタッチするかどうか、または5分棒トレンド切替などを
活用しなければなりません。
今日、紫色の支持線は最後の中期上昇傾向線でもあります。
テザードミナンスでも上昇傾向にあるので
落ちるには名分が必要です。
現在の傾向状況では、まさにホッソが出てくるかどうかを見なければなりません。
(逆に動くビットの場合には調整なしで暴灯)
下部に1番区間がポイントになるのは
*今日のナスダックで一峰を支持+主峰中央線のパターンで
反騰が成功した場合
下段に1番区間で反騰が出ることができるという点です。
ビットの場合、抵抗ラインタッチなし
引き続き垂直下落中であるため、
4時間、6時間チャートMACDデッドクロスが完璧に刻印されて
追加キャンドルが生成される9時以降の動きが重要です。
リアルタイムで参考にして操作してください。
ここまで、
原則売買、手折が必須で安全に運営していただきたいです
ありがとうございます。
