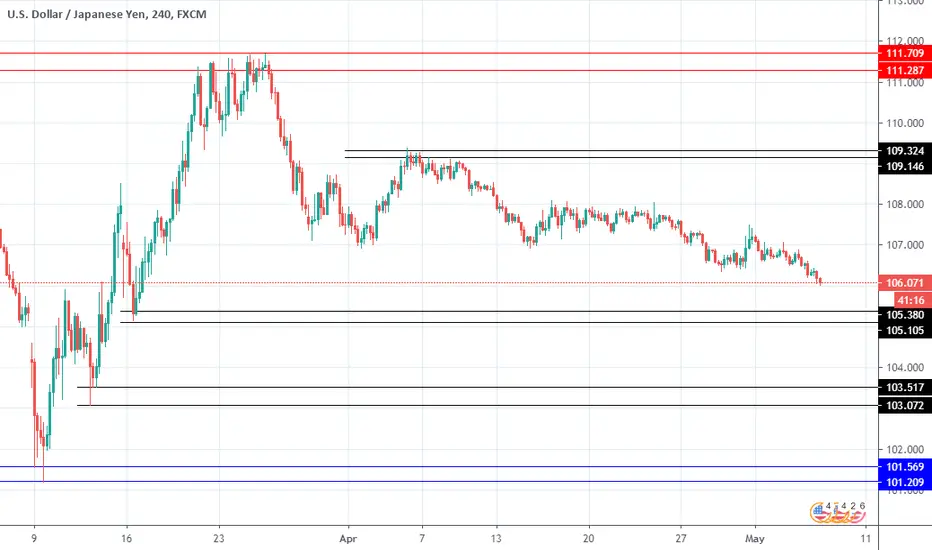
In the above analysis on 4 hr timeframe scenario. I have drawn 2 horizontal lines as resistance and support levels zone.
The other 3 lines of horizontal rays are the breakout level of zones.
Disclaimer:- This is not an entry signal nor a trade setup. This is my just reference analysis and it's for educational purpose.
The other 3 lines of horizontal rays are the breakout level of zones.
Disclaimer:- This is not an entry signal nor a trade setup. This is my just reference analysis and it's for educational purpose.
免責事項
これらの情報および投稿は、TradingViewが提供または保証する金融、投資、取引、またはその他の種類のアドバイスや推奨を意図したものではなく、またそのようなものでもありません。詳しくは利用規約をご覧ください。
免責事項
これらの情報および投稿は、TradingViewが提供または保証する金融、投資、取引、またはその他の種類のアドバイスや推奨を意図したものではなく、またそのようなものでもありません。詳しくは利用規約をご覧ください。